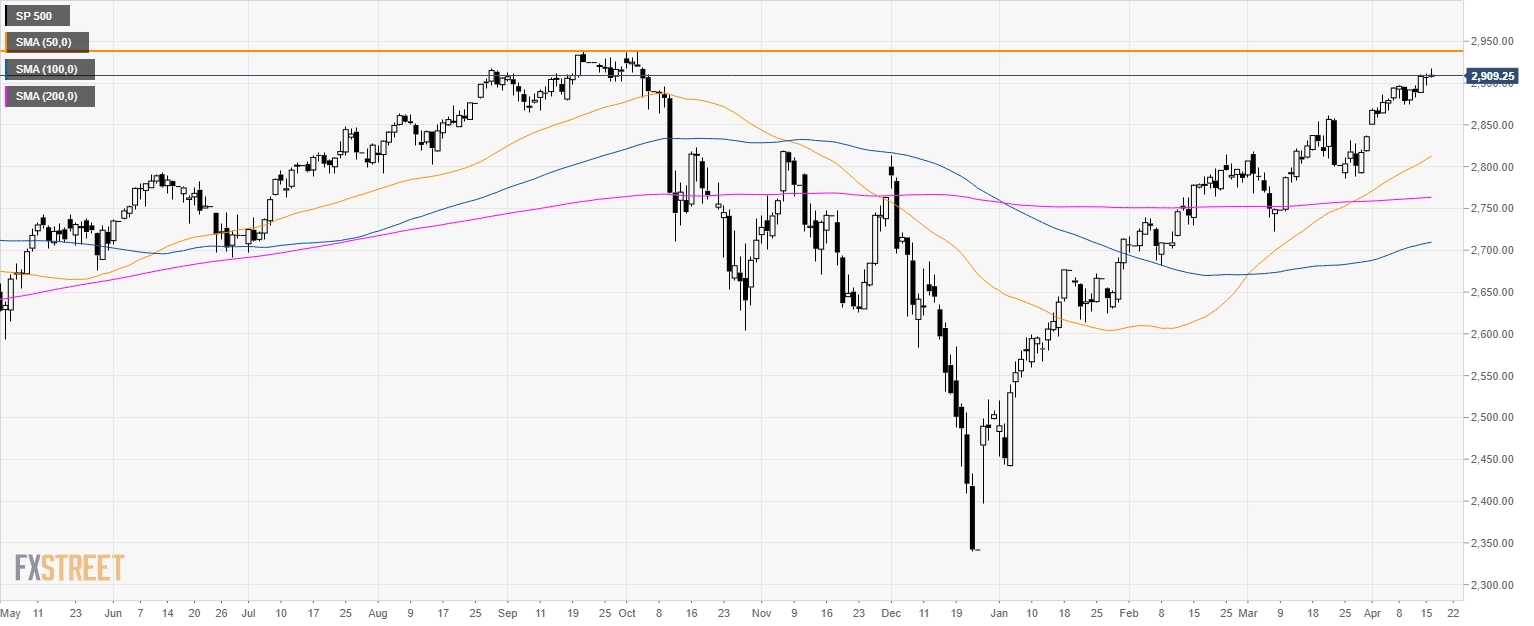
S&P500 daily chart
- The S&P500 index is trading in a bull trend above its main simple moving averages (SMAs).
- The index is approaching a key level at 2,940.00.
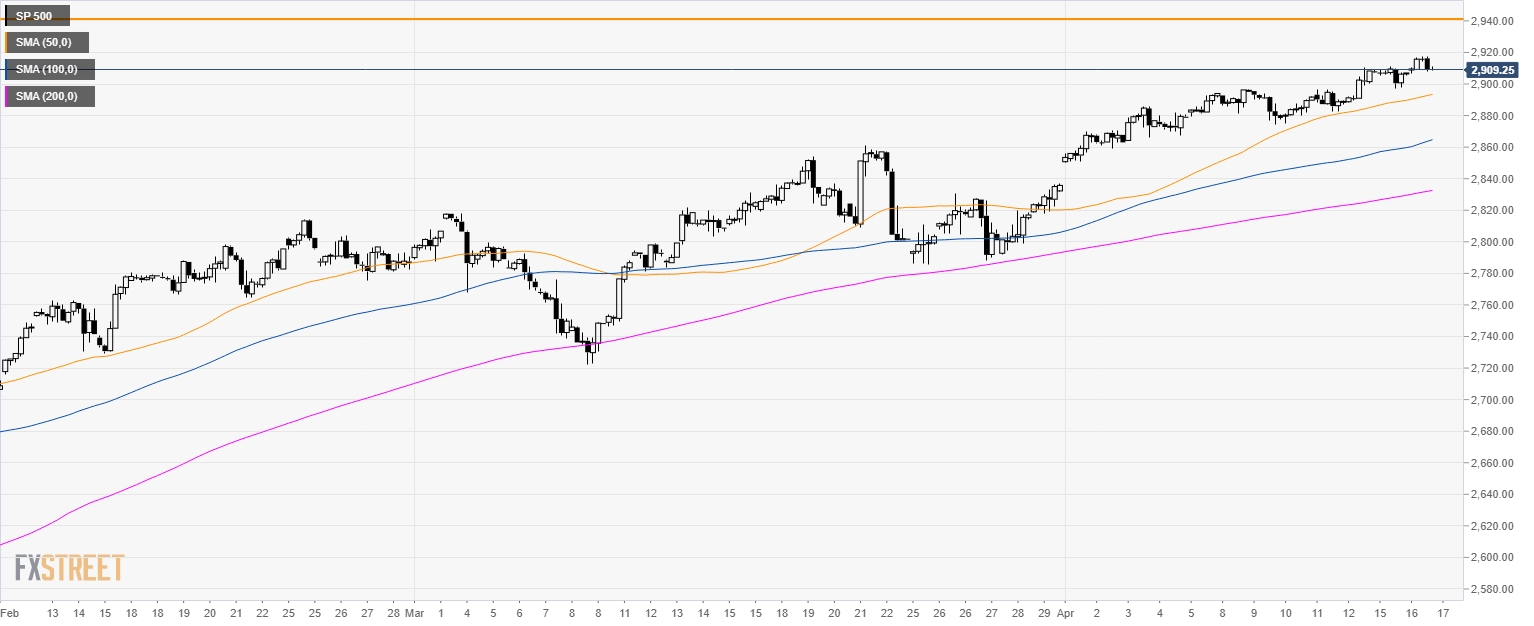
S&P500 4-hour chart
- The S&P500 is trading above its main SMAs suggesting bullish momentum the medium-term.
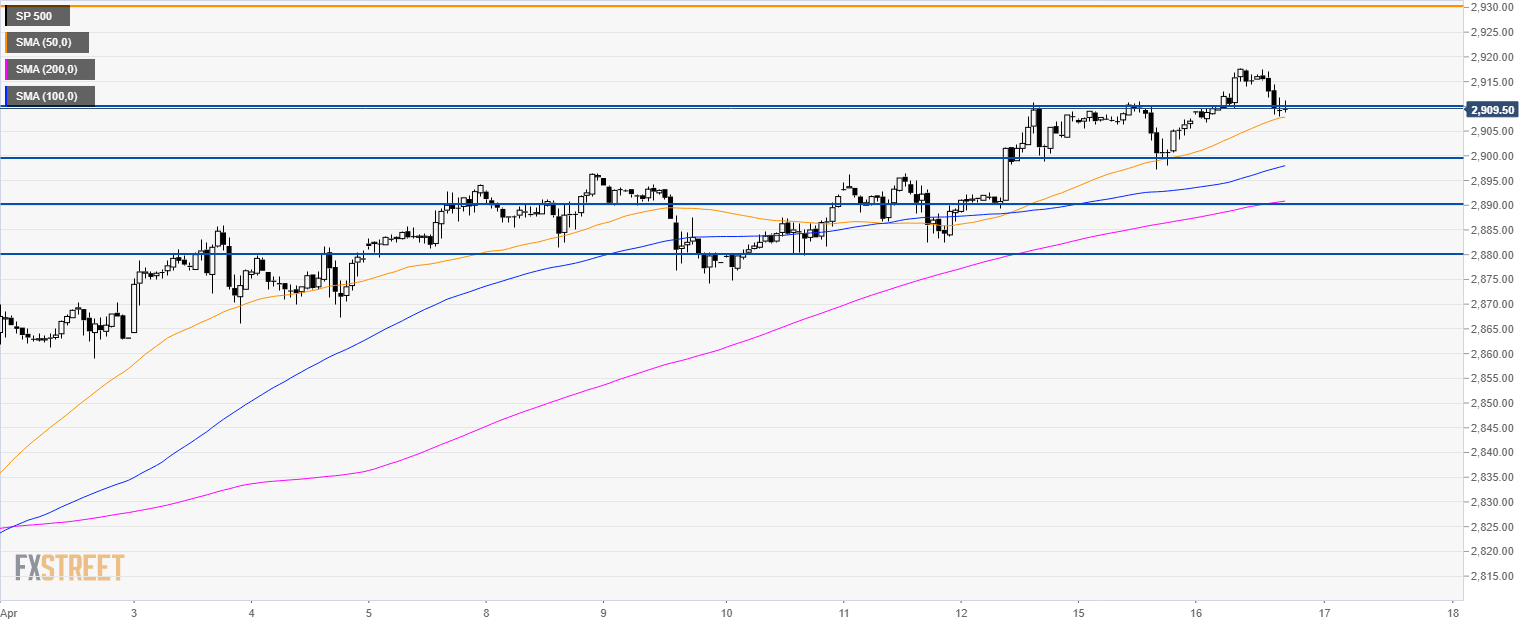
S&P500 60-minute chart
- The S&P500 is trading above its main SMAs as the bull trend is intact for the time being.
- Bears erased the daily gains driving the market down to the 2910.00 support and the 50 SMA.
- Looking down, investors can expect support at 2,900.00; 2,890.00 and 2,880.00 level.
Additional key levels
