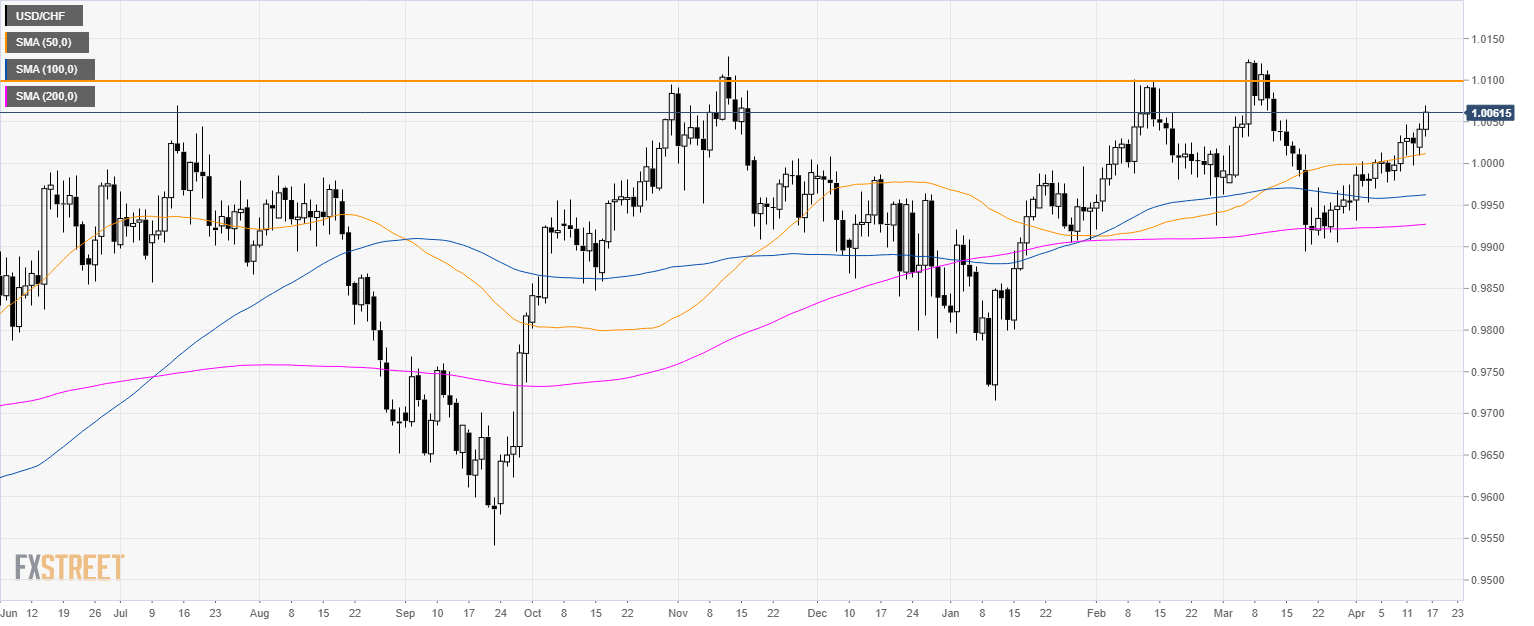
USD/CHF daily chart
- USD/CHF is trading above the 50-day simple moving average (SMA) and the parity level.
- As mentioned, the 1.0060 and 1.0070 level were important resistances to look at.
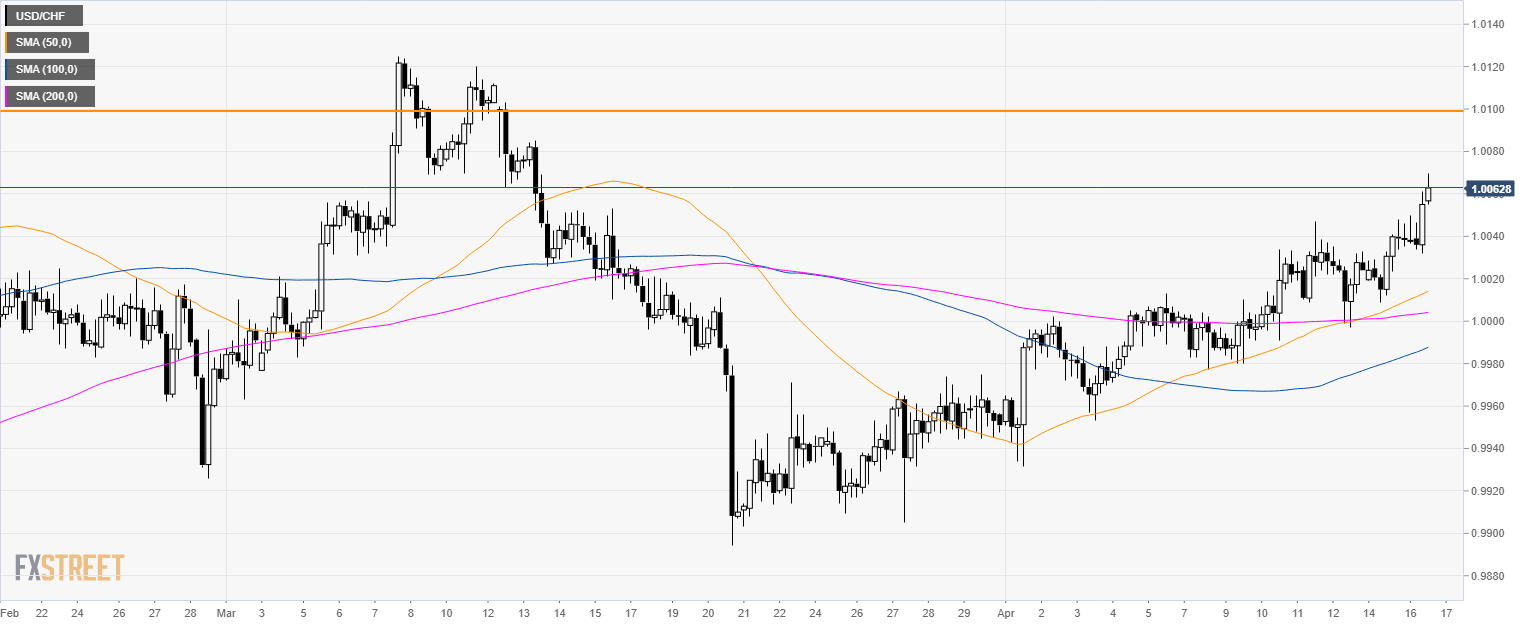
USD/CHF 4-hour chart
- The 50 SMA crossed above the 200 SMA.
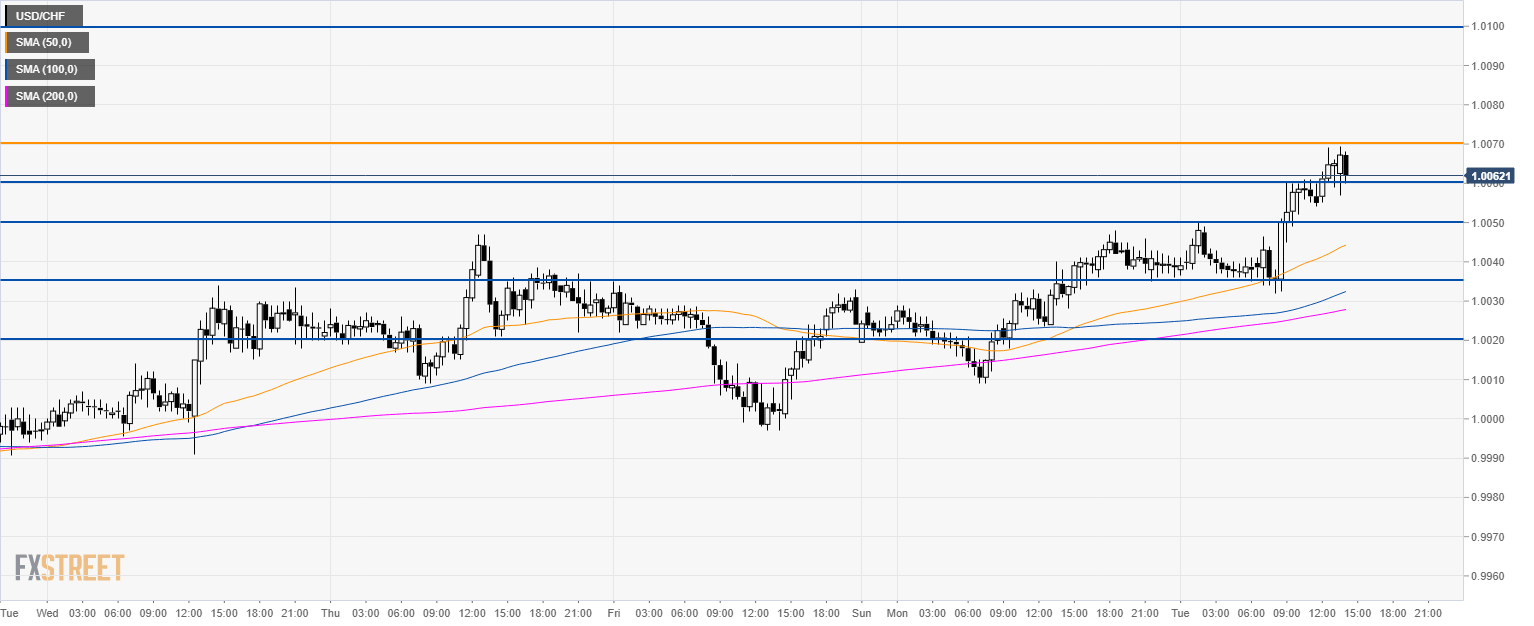
USD/CHF 30-minute chart
- The path of least resistance remains to the upside. The next main target is seen at the 1.0100 level.
- Support is at 1.0050 and 1.0020 level.
Additional key levels
