AUD/NZD is at the highest levels since late-November as it trades around 1.0685 during the early Asian session on Wednesday.
The pair crossed 200-day simple moving average (SMA) after New Zealand CPI for the first quarter (Q1) 2019 lagged behind 0.3% and 1.7% market consensus on QoQ and YoY basis to 0.1% and 1.5% respectively.
The quote now needs to hold its break beyond 1.0685 figure in order to aim for 1.0755/65 area including late-2018 highs.
Should buyers dominate beyond 1.0765, 1.0800, 1.0840 and 1.0885 are likely following numbers to appear on the chart.
Alternatively, failure to hold recent rally and a dip beneath January month high near 1.0670 can recall 61.8% Fibonacci retracement of it’s August 2018 to January 2019 downpour, at 1.0600.
During the pair’s additional declines under 1.0600, 1.0530, 1.0500 and 100-day SMA level of 1.0485 may gain bears’ attention.
AUD/NZD daily chart
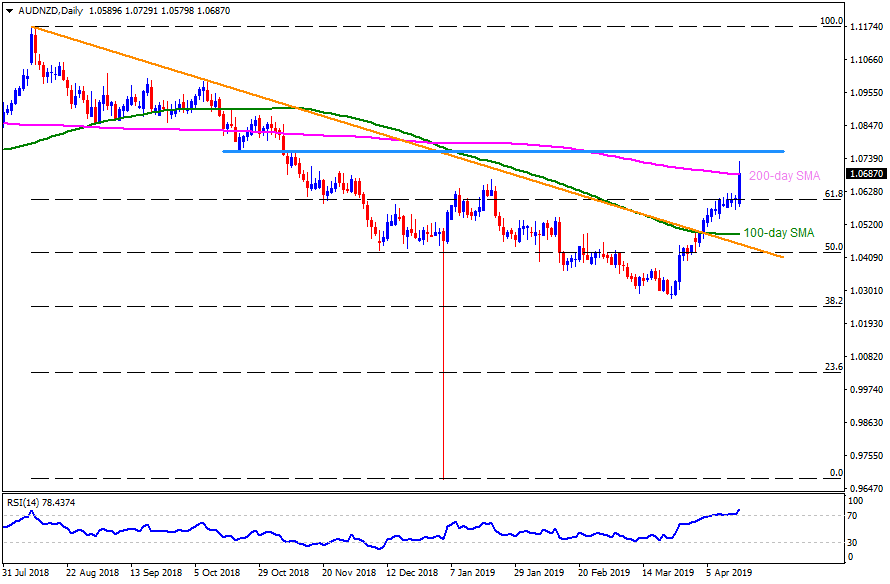
Trend: Positive
