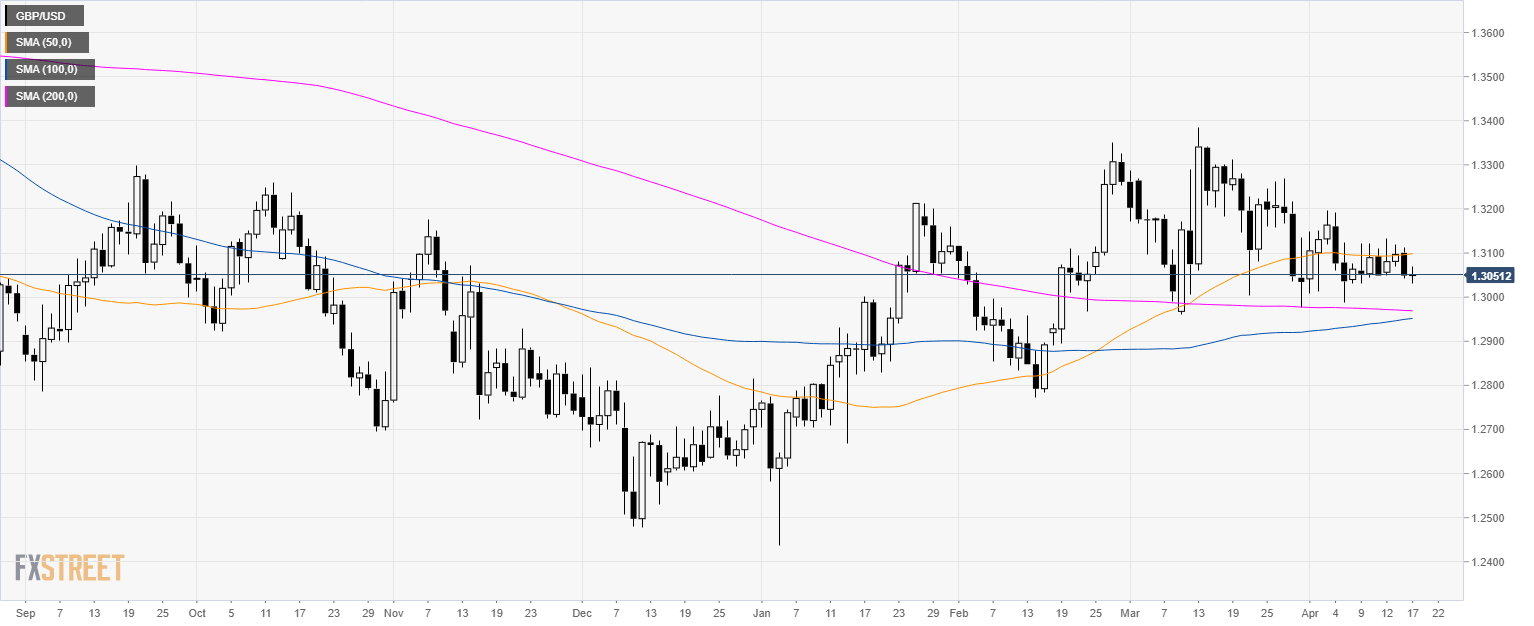
GBP/USD daily chart
- GBP/USD is consolidating below 1.3100 and the 50-day simple moving average (SMA).
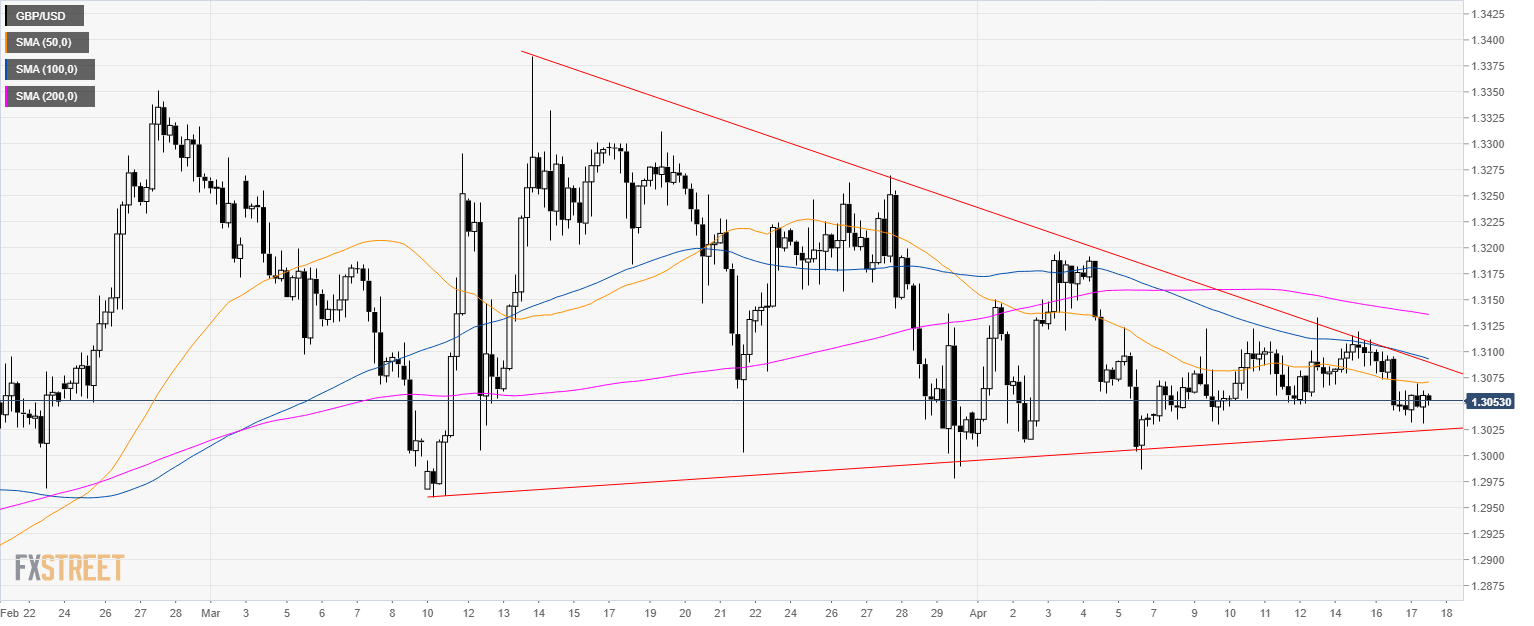
GBP/USD 4-hour chart
- GBP/USD is trapped in a wedge pattern.
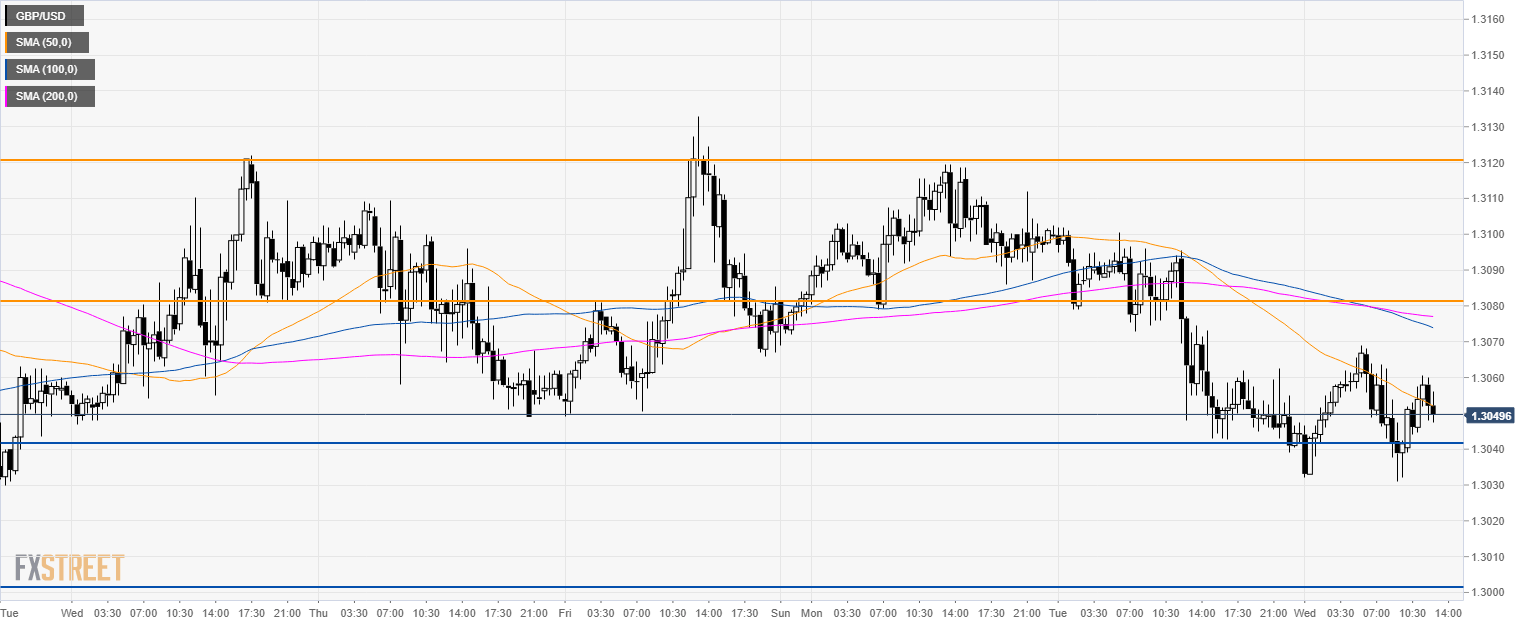
GBP/USD 30-minute chart
- As mentioned yesterday, the market found some support at the 1.3040 level.
- The market might remain in range between 1.3040 and 1.3080 in the New York session.
- Bulls need a break of 1.3080 to reach 1.3120 level while bears need to break below 1.3040 to reach 1.3000 the figure.
Additional key levels
