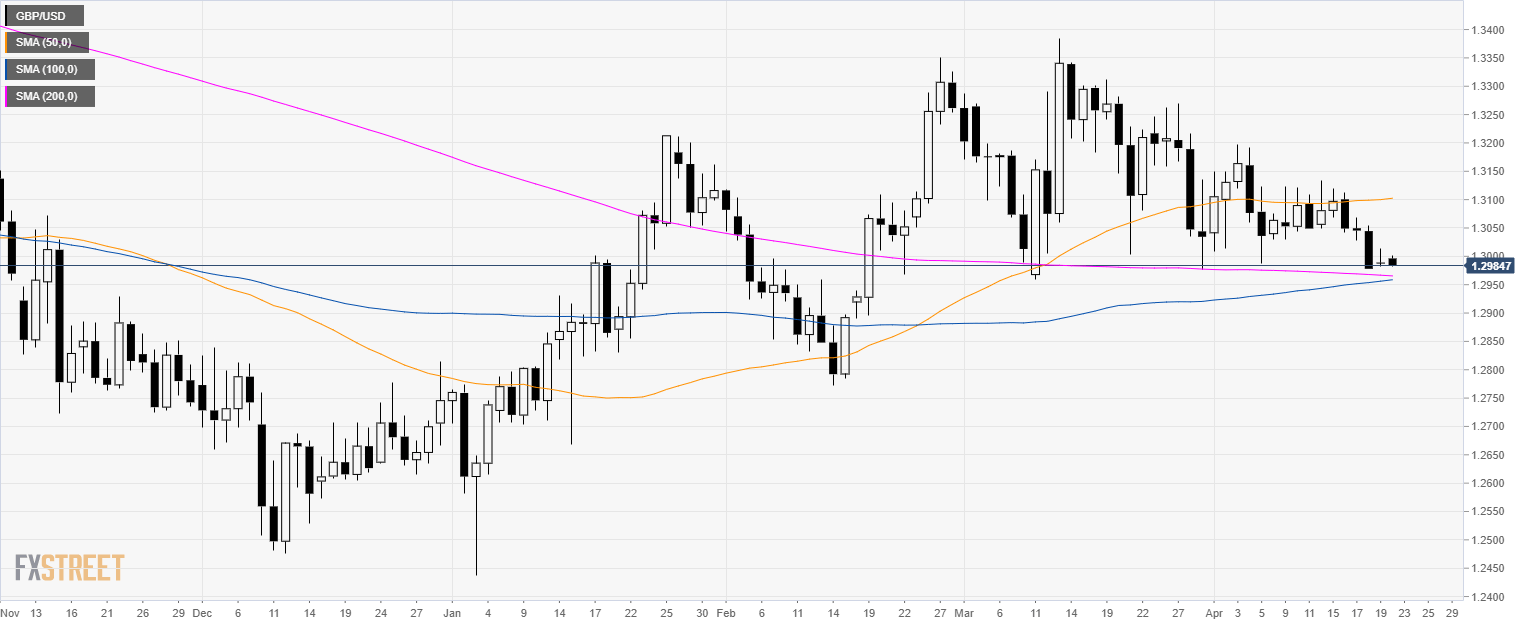
GBP/USD daily chart
- GBP/USD is trading in a consolidation above its 200-day simple moving average (SMA).
- Volatility is likely going to be limited on Easter Monday.
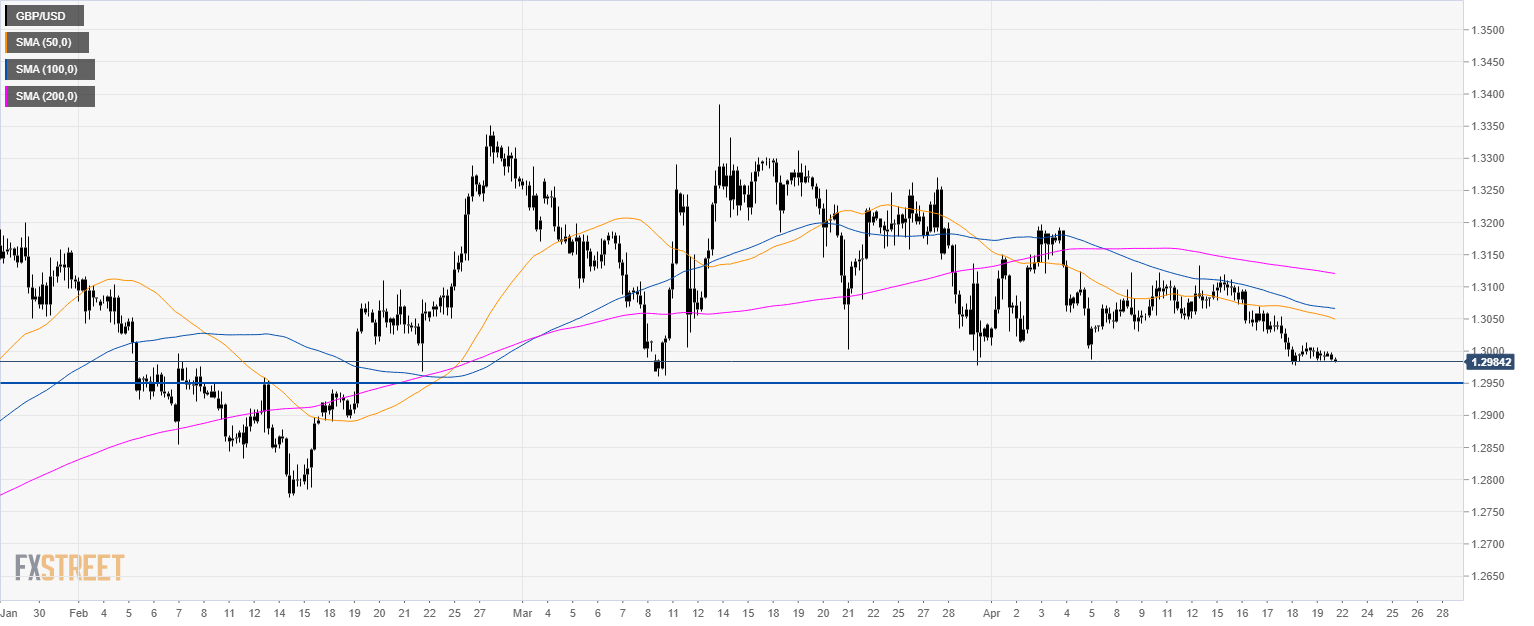
GBP/USD 4-hour chart
- GBP/USD is hovering above 1.2950 key support.
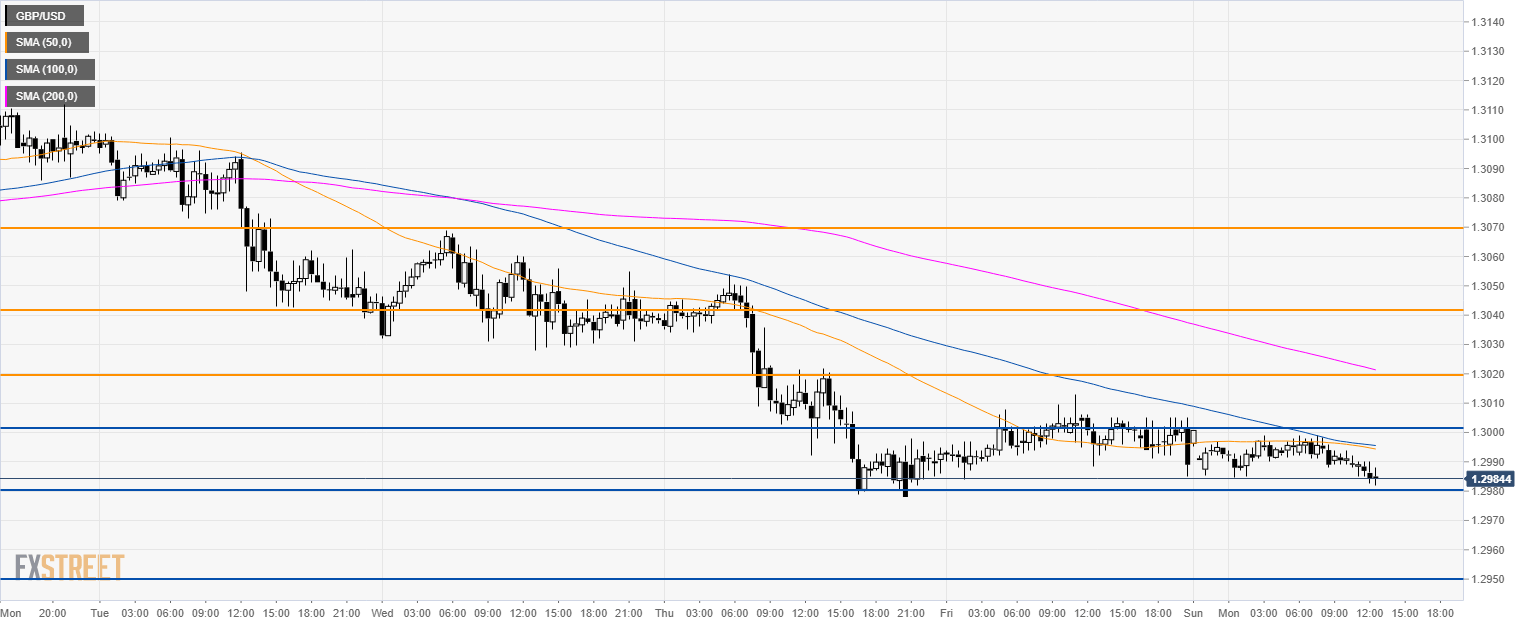
GBP/USD 30-minute chart
- The market is trading below its main SMAs suggesting a negative bias in the short-term.
- 1.2880 is a key intraday support and a break below would open the gates to 1.2950 level.
- Alternatively, a bounce at 1.2880 can lead to a recovery to 1.3000 and 1.3020 level
Additional key levels
