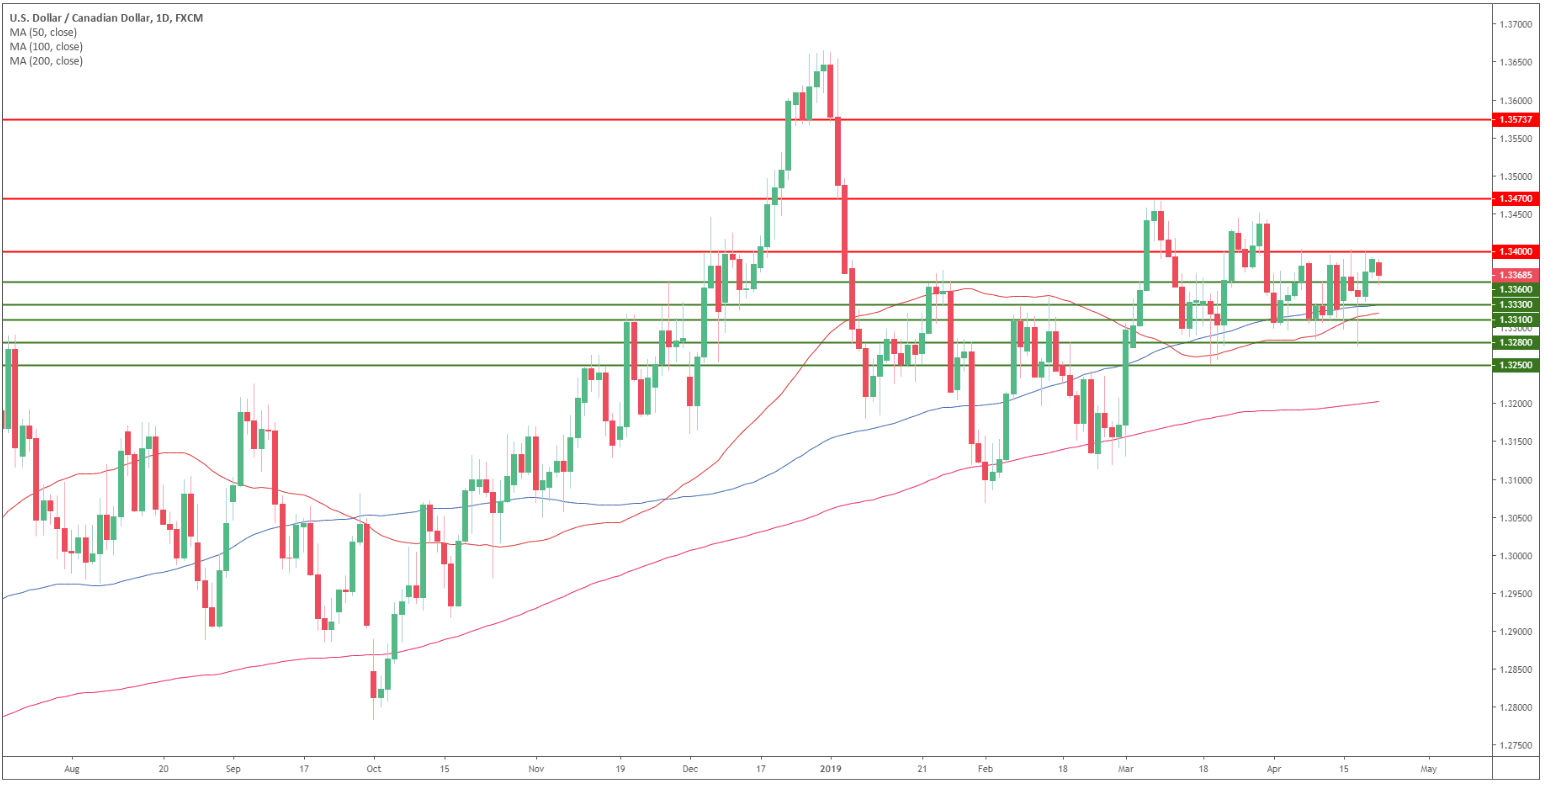
USD/CAD daily chart
- USD/CAD is trading in a bull trend above its 200 simple moving average (SMA).
- USD/CAD is in a very tight range below 1.3400 figure.
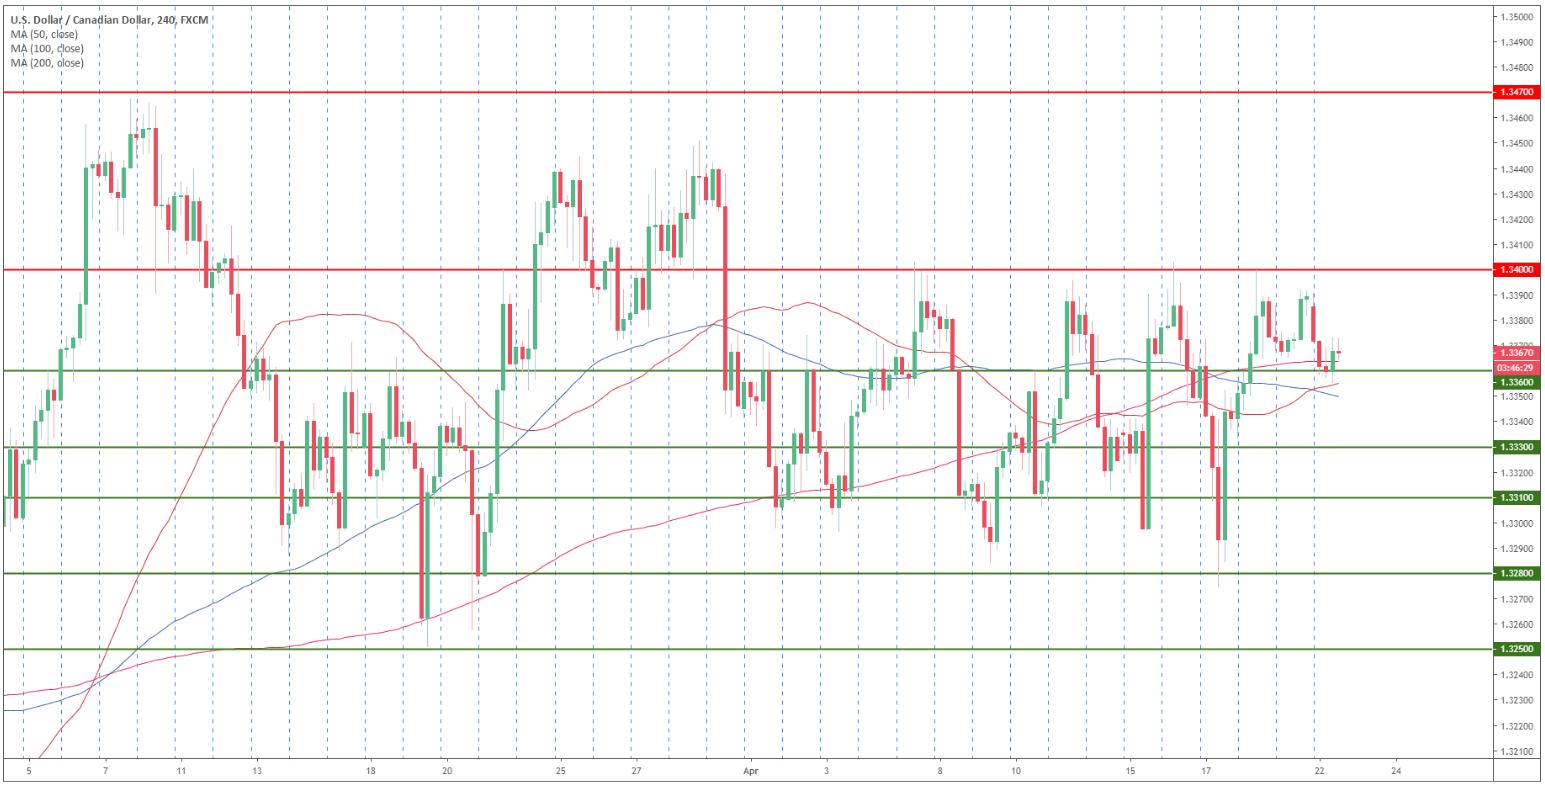
USD/CAD 4-hour chart
- USD/CAD is drifting just above the 200 SMA.
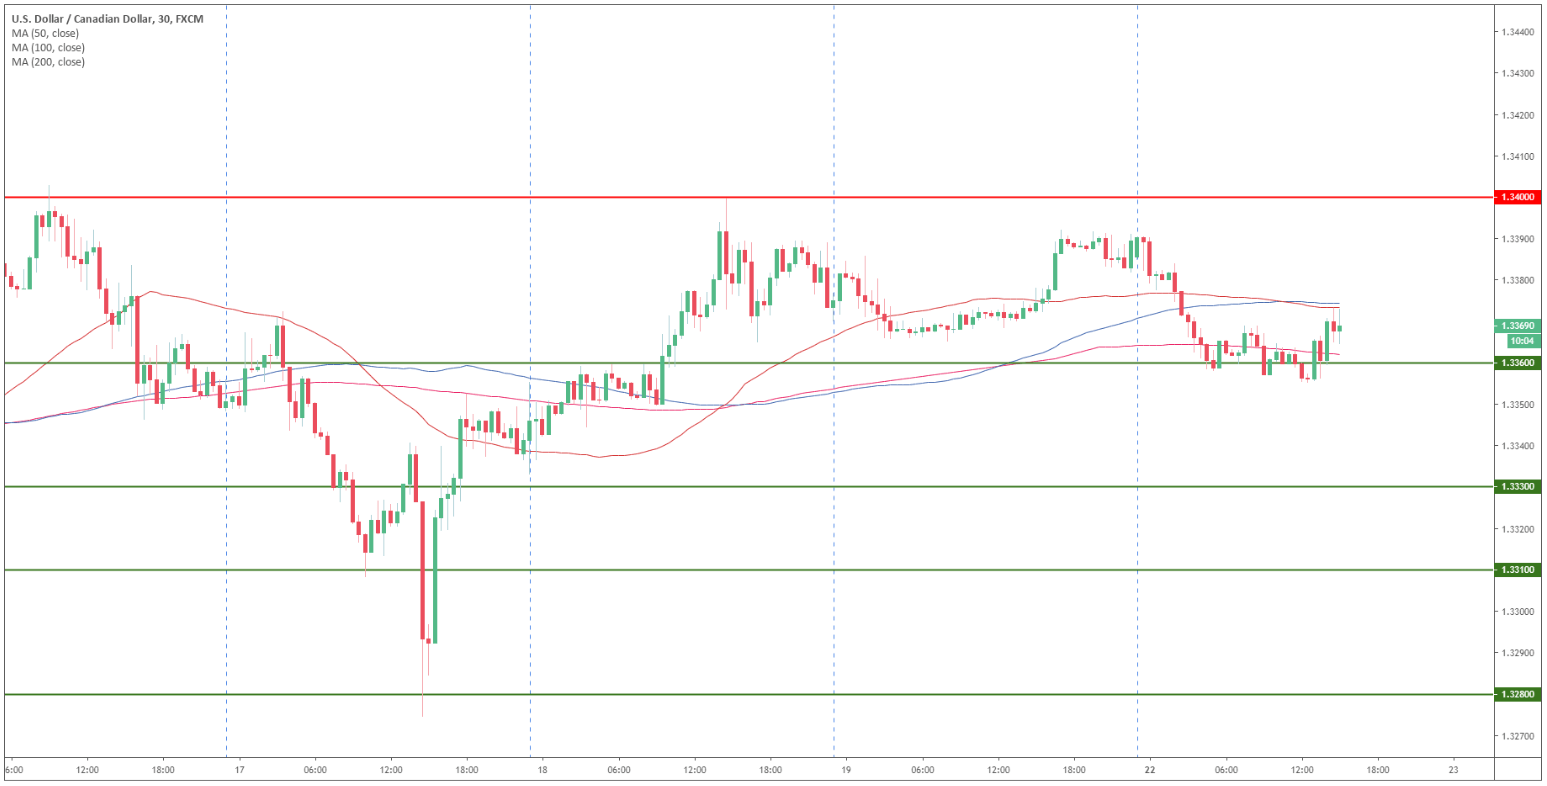
USD/CAD 30-minute chart
- As USD/CAD is trading below the 50 and 100 SMA, in the short-term USD/CAD is seen declining towards 1.3330, 1.3310 and 1.3280 level.
- Buyers would need a convincing break above 1.3400 to relaunch the bull trend to 1.3470 resistance.
Additional key levels


