Having failed to cross the horizontal-line connecting highs marked since mid-April, Gold drops to the lowest in a week as it trades near $1274.
Given the bullion’s sustained trading beneath important resistance, coupled with downward sloping 14-bar relative strength index (RSI), prices are likely to extend recent downturn towards next strong supports, like recent lows near $1271.
However, 61.8% Fibonacci expansion of the moves from April 15 to 22 around $1268 could question the sellers’ strength then after.
Also, quote’s south-run beneath $1268 highlights the importance of an upward sloping trend-line stretched since August 2018, at $1262 now.
In a case of pullback, $1276 and a descending resistance-line at $278 may limit immediate advances ahead of shifting buyers’ attention to $1280.
If at all $1280 falls short of holding the bulls confined, $1283, $1287 and $1290 are likely following numbers to grab the spotlight.
Gold hourly chart
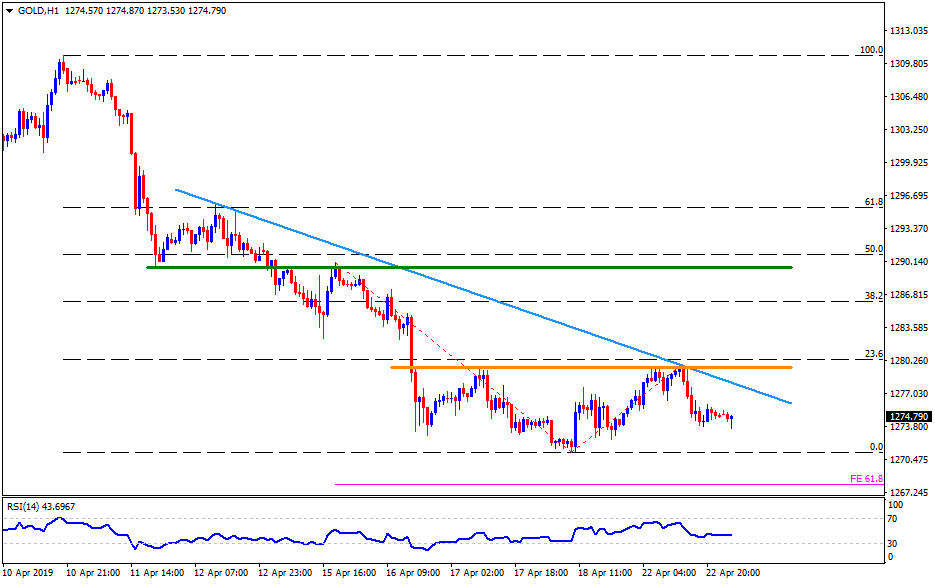
Trend: Bearish
