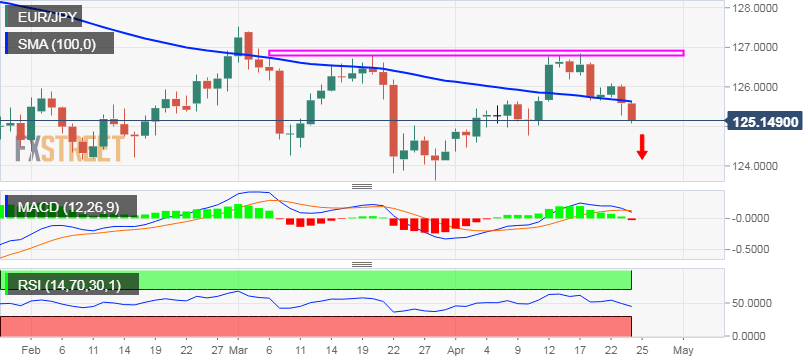
“¢ Last week, the cross once again faced rejection near the 126.80 region and now seems to have formed a bearish double-top chart pattern on the daily chart.
“¢ A follow-through weakness back below 100-day SMA was seen as a key trigger for bearish traders and dragged the cross to near two-week lows on Wednesday.
“¢ Oscillators on the 4-hourly chart have been losing momentum and have already drifted into the bearish territory on the daily chart, suggesting further downside.
“¢ A convincing break through the key 125.00 psychological mark will add credence to the bearish outlook and accelerate the slide towards the 124.00 handle.
“¢ The downward momentum could further get extended towards challenging March swing lows, around the 123.65 region, en–route YTD lows, near the 123.40 area.
EUR/JPY daily chart

