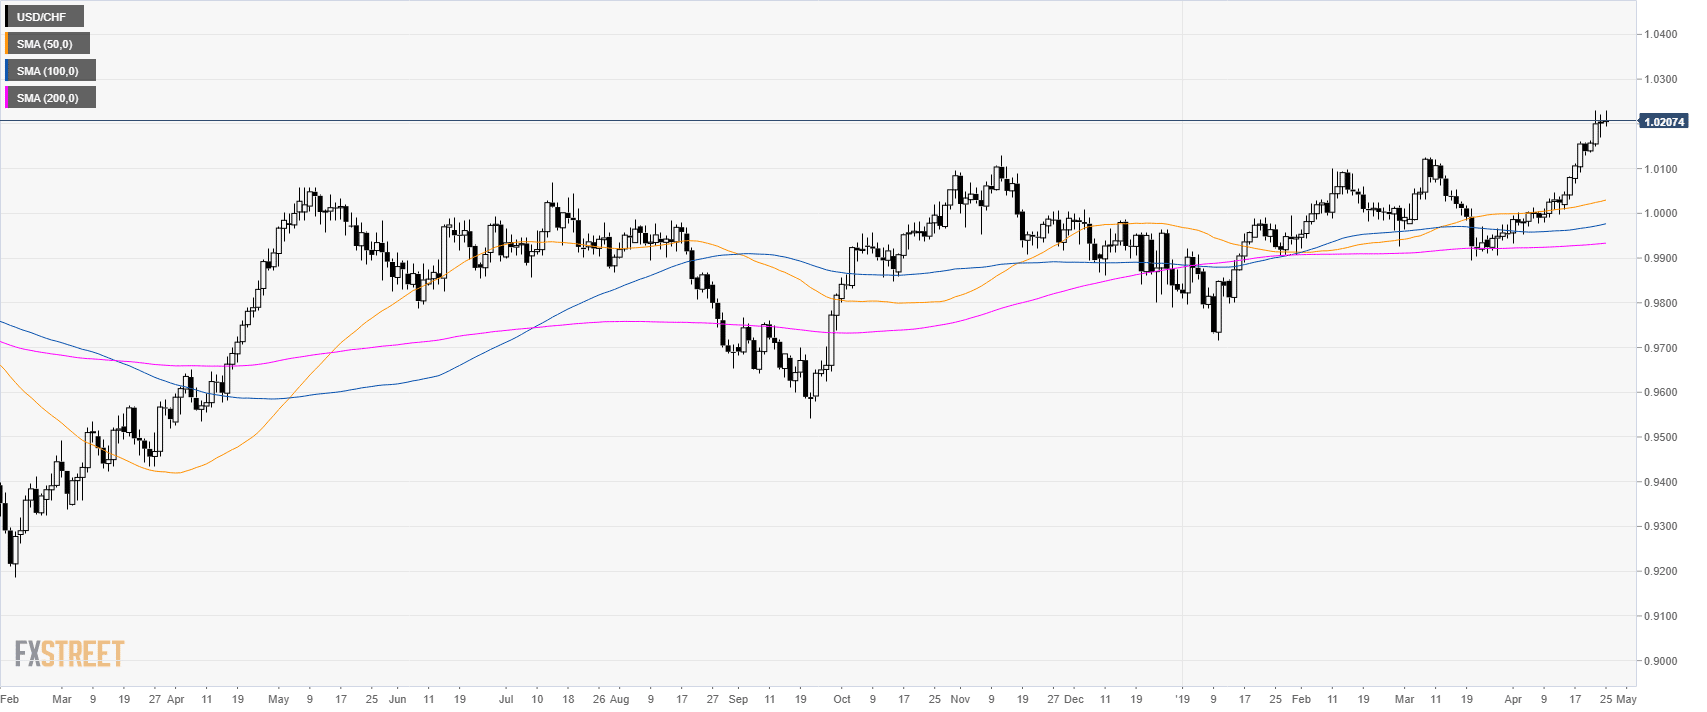
USD/CHF daily chart
- USD/CHF is trading at its highest level since January 2017.
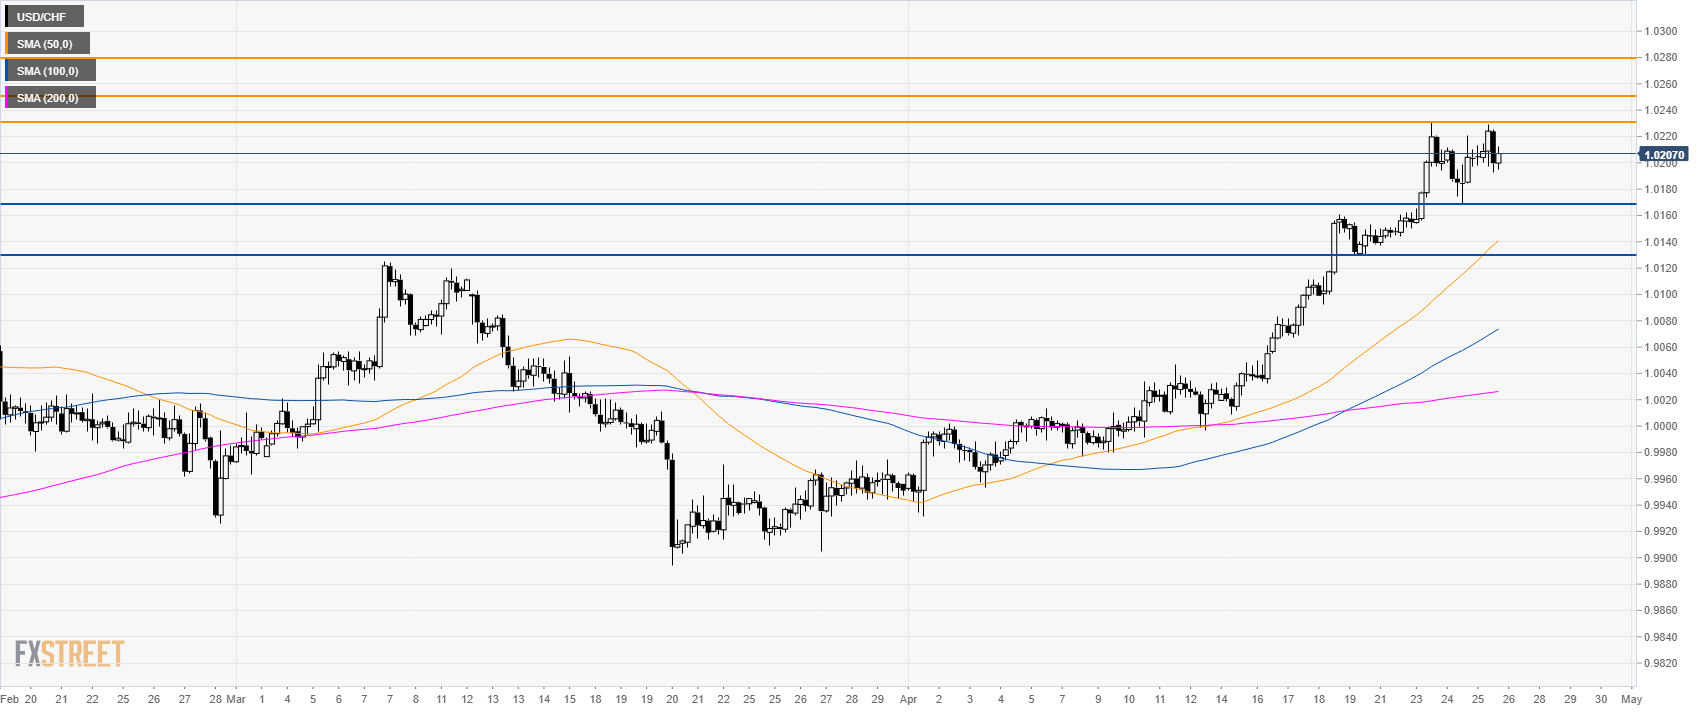
USD/CHF 4-hour chart
- The bull trend remains intact above the main simple moving averages (SMAs).
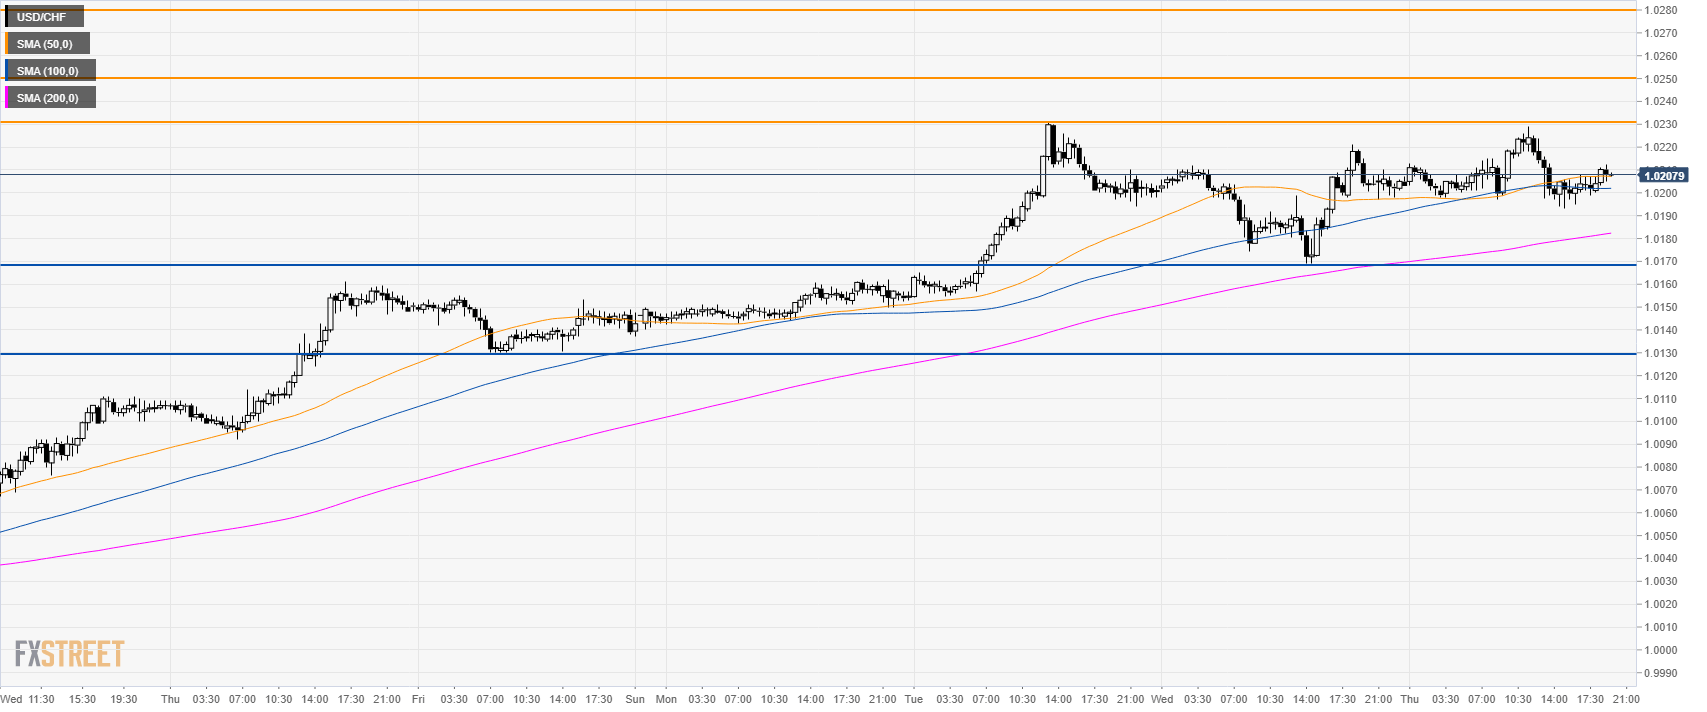
USD/CHF 30-minute chart
- The momentum is tilted to the upside as USD/CHF is trading above its main SMAs.
- The next resistances to overcome are likely located at 1.0230, 1.0250 and 1.0280 price level.
- Looking down, 1.0170 and 1.0130 are seen as support levels.
Additional key levels


