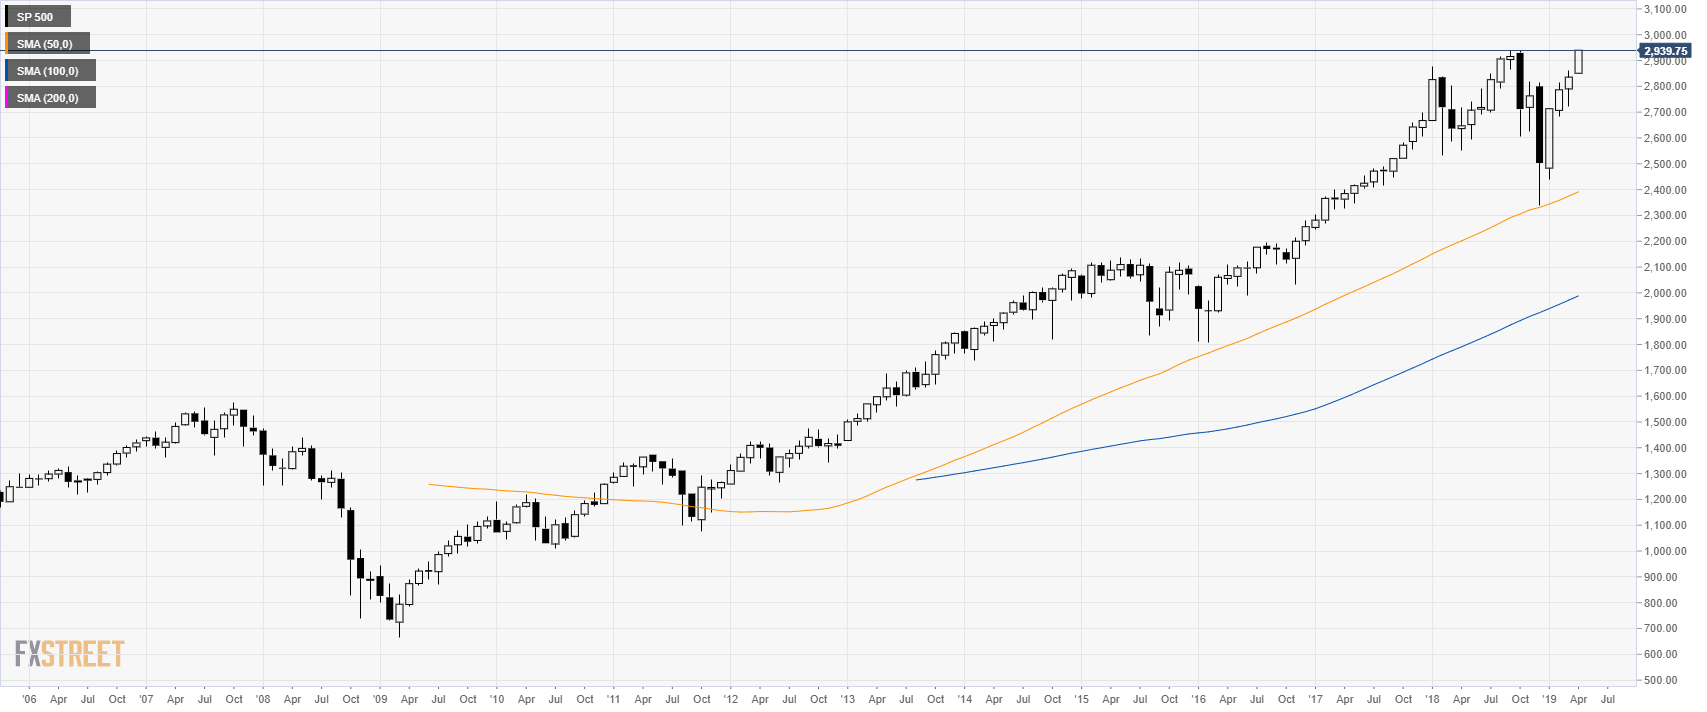
S&P500 monthly chart
- The market is trading to a new all-time high at 2,940.50
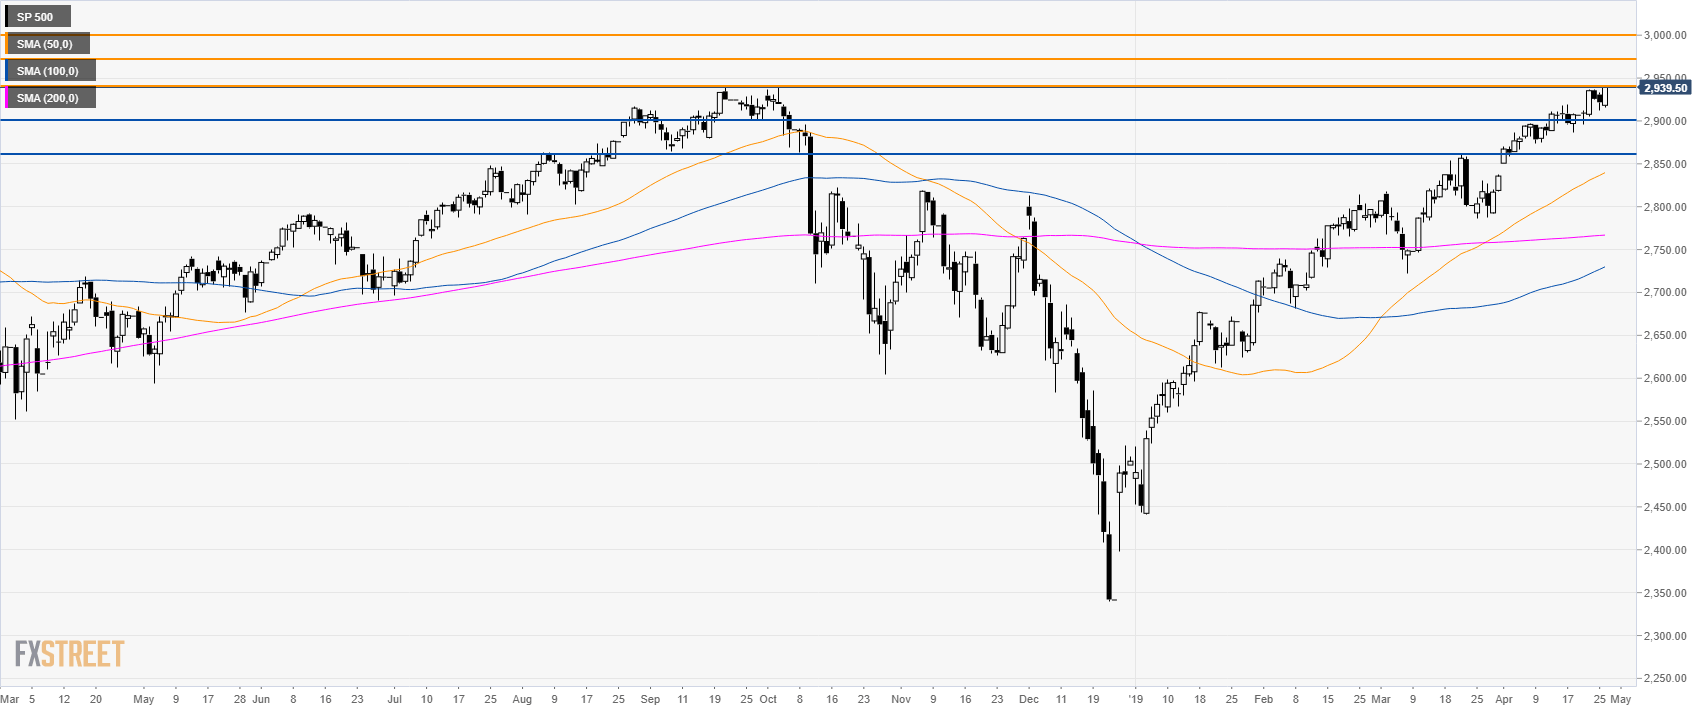
S&P500 daily chart
- As bulls are breaking above 2,940.50 they would likely open the gates to 2,970.00 and the 3,000.00 psychological level.
- To the downside, support is likely seen at 2,900.00 and 2,860.00 level.
Additional key levels
