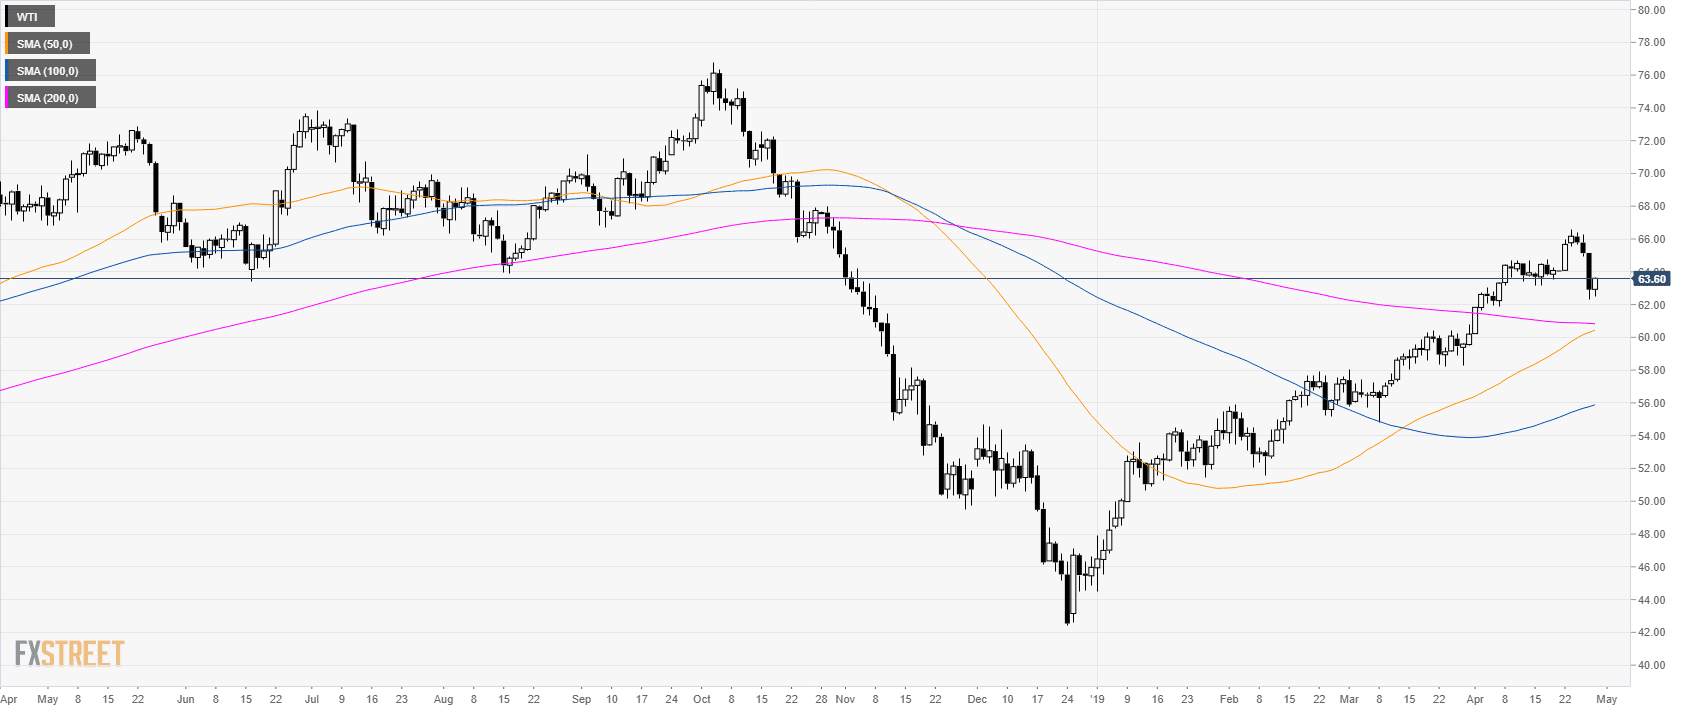
Oil daily chart
- WTI is trading in a bull trend above its main simple moving averages (SMAs).
- WTI is consolidating the $2.8 decline of last Friday.
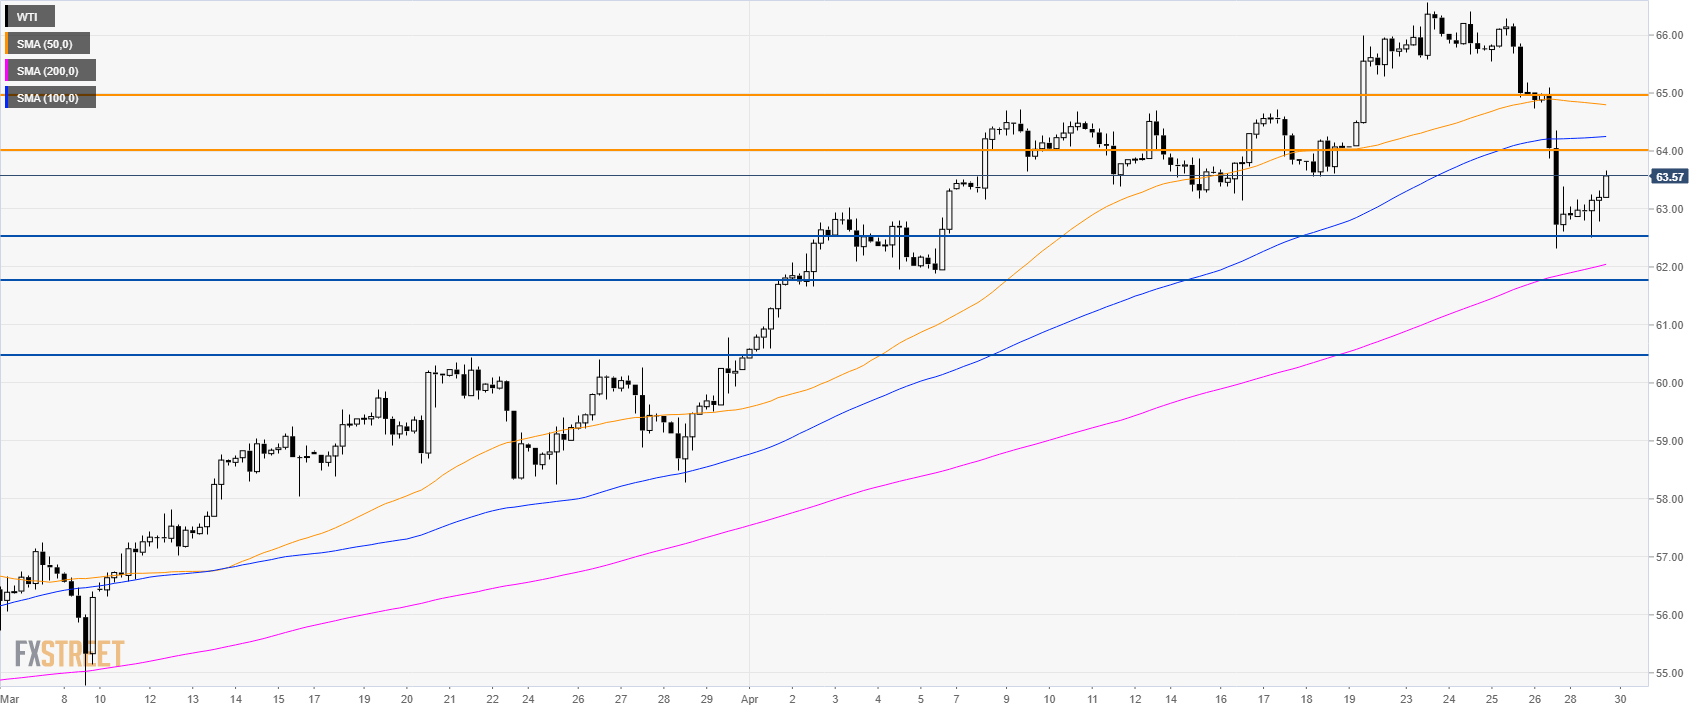
Oil 4-hour chart
- WTI found support at 62.50 and is now en route towards 64.00 the figure.
- If bulls can breach that level then 65.00 can be the next resistance in line.
- Support is seen at 61.80 and 60.50.
Additional key levels
