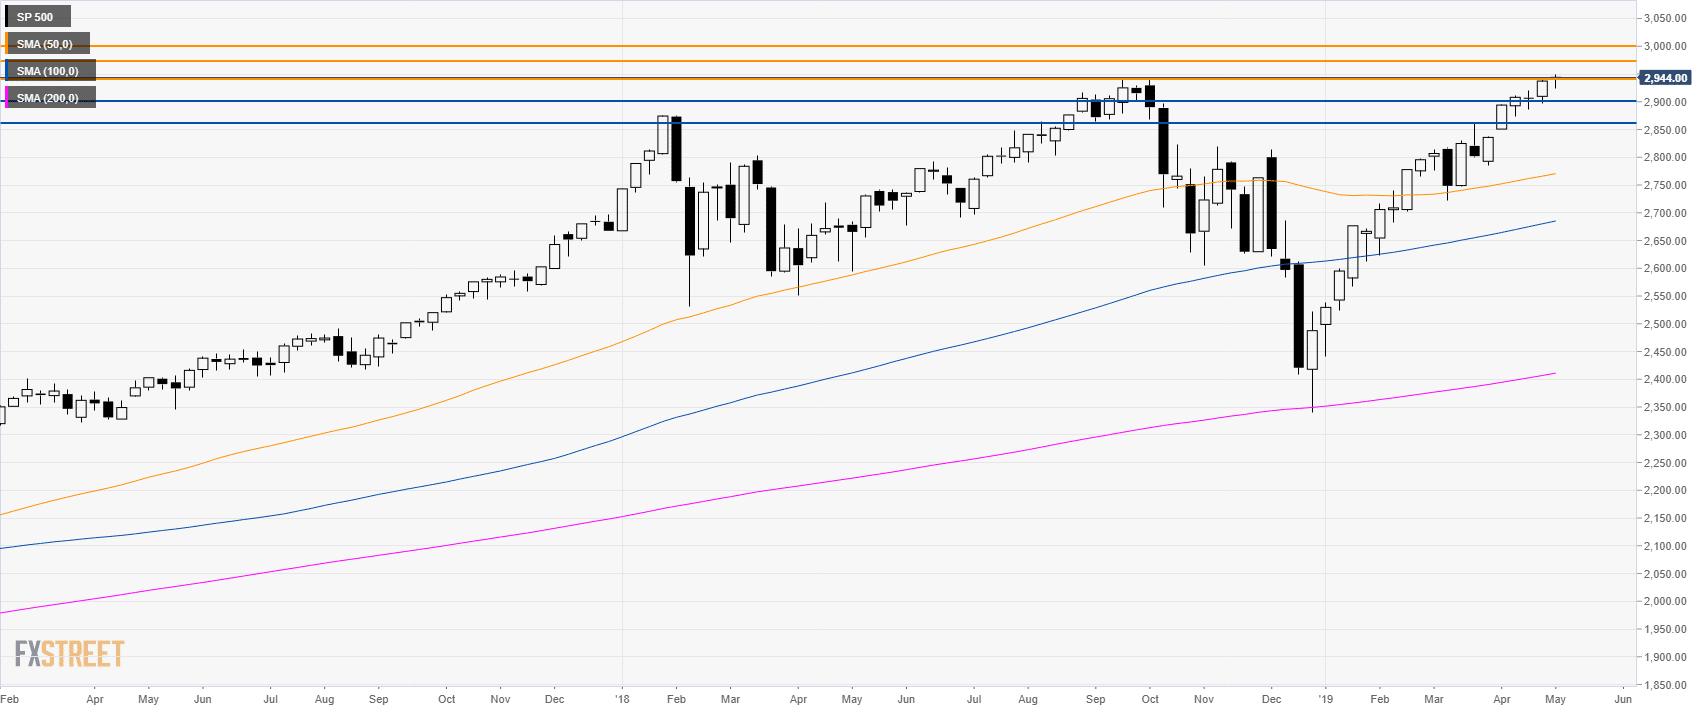
S&P500 weekly chart
- The market is trading near the all-time high at 2,950.00.
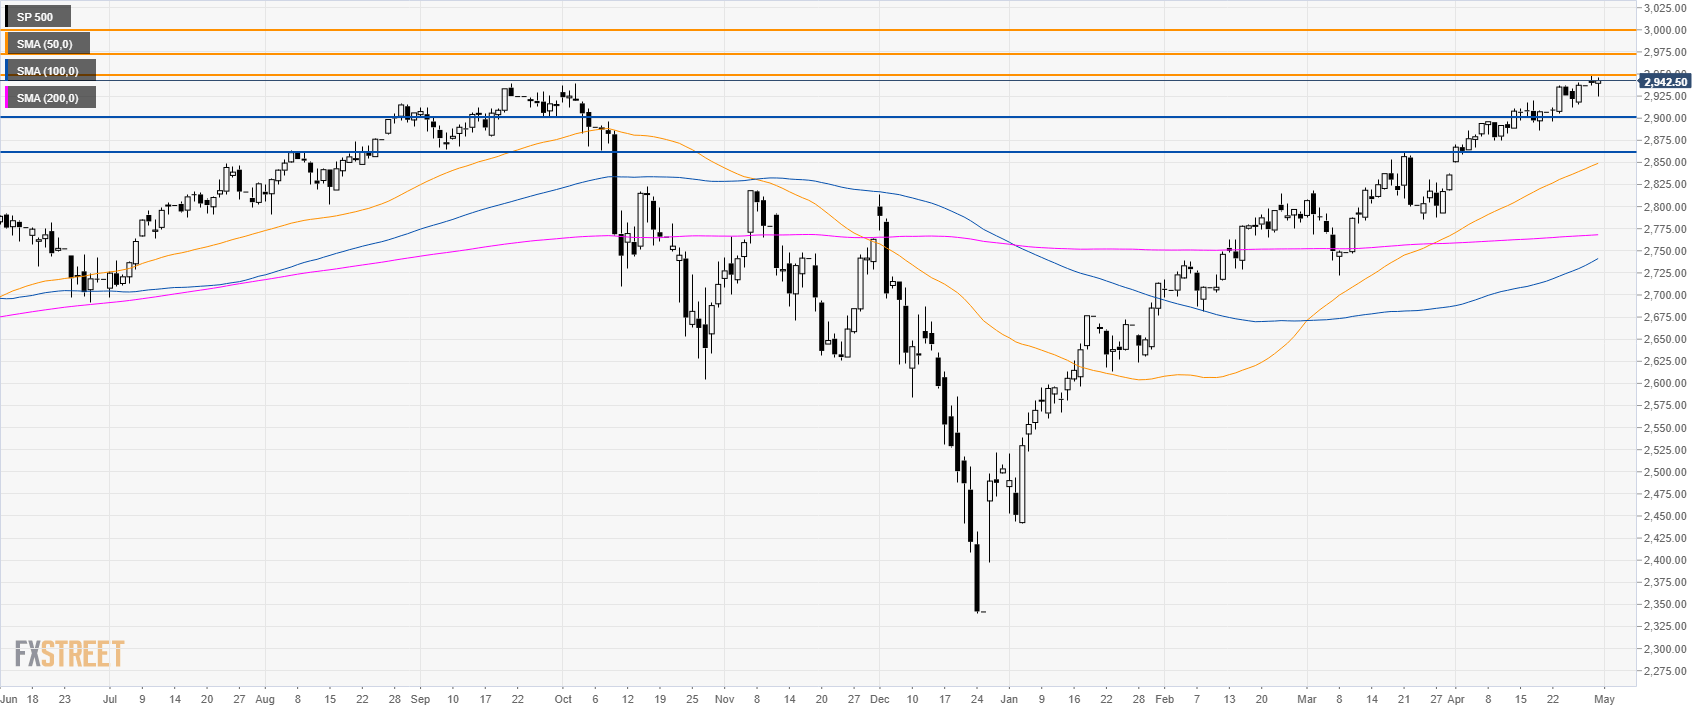
S&P500 daily chart
- The market is trading above its main SMAs as bulls are pressuring the all-time high.
- A bull break above 2,950.00 resistance can send the US stock index in uncharted territory. Buyers will likely target 2,970.00 and the 3,000.00 psychological level.
- To the downside, support is seen at 2,900.00 and 2,860.00 level.
Additional key levels
