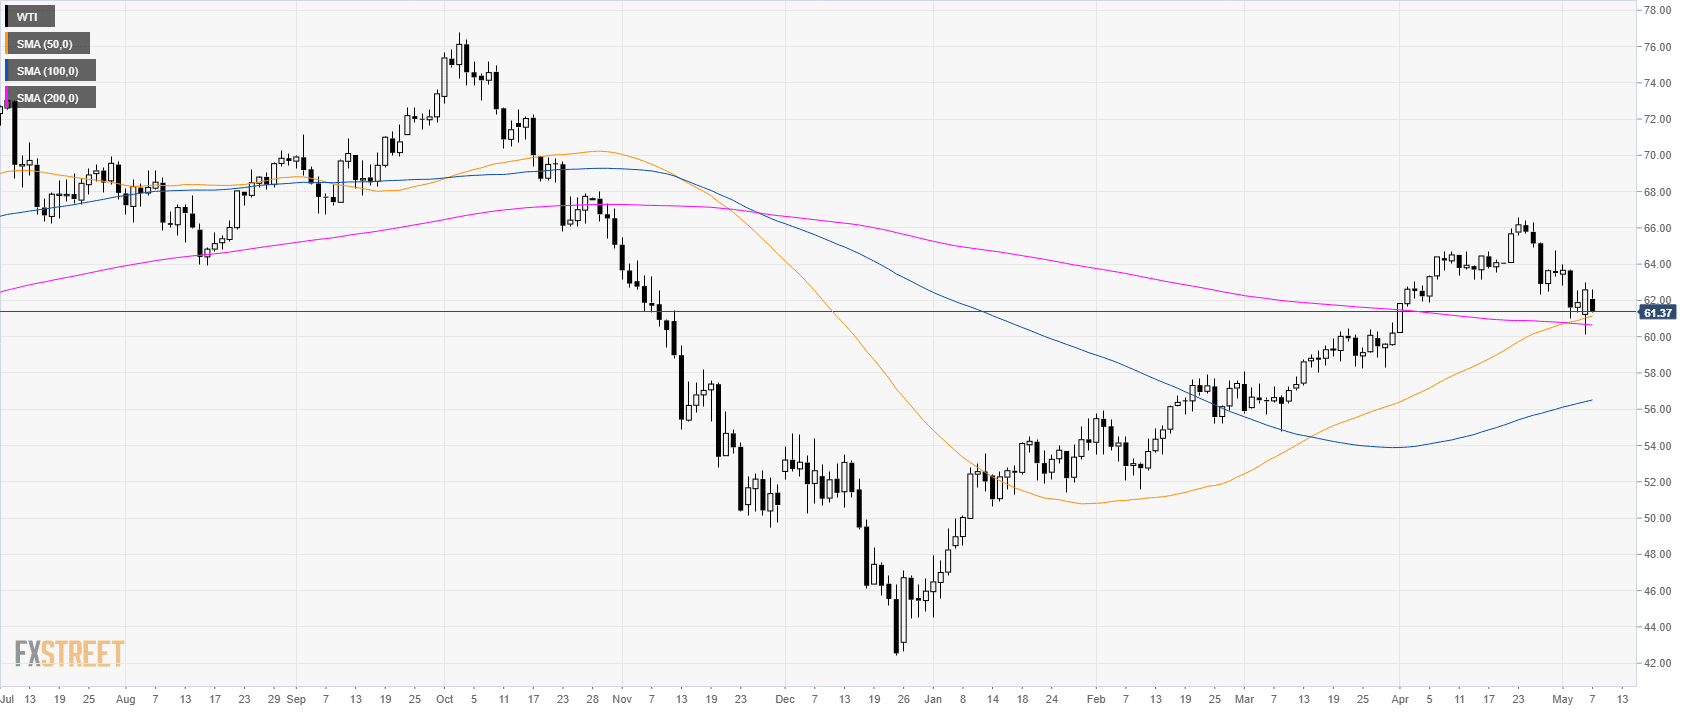
Oil daily chart
- WTI is trading in a bull trend above its main simple moving averages (SMAs).
- The market is consolidating yesterday’s gains.
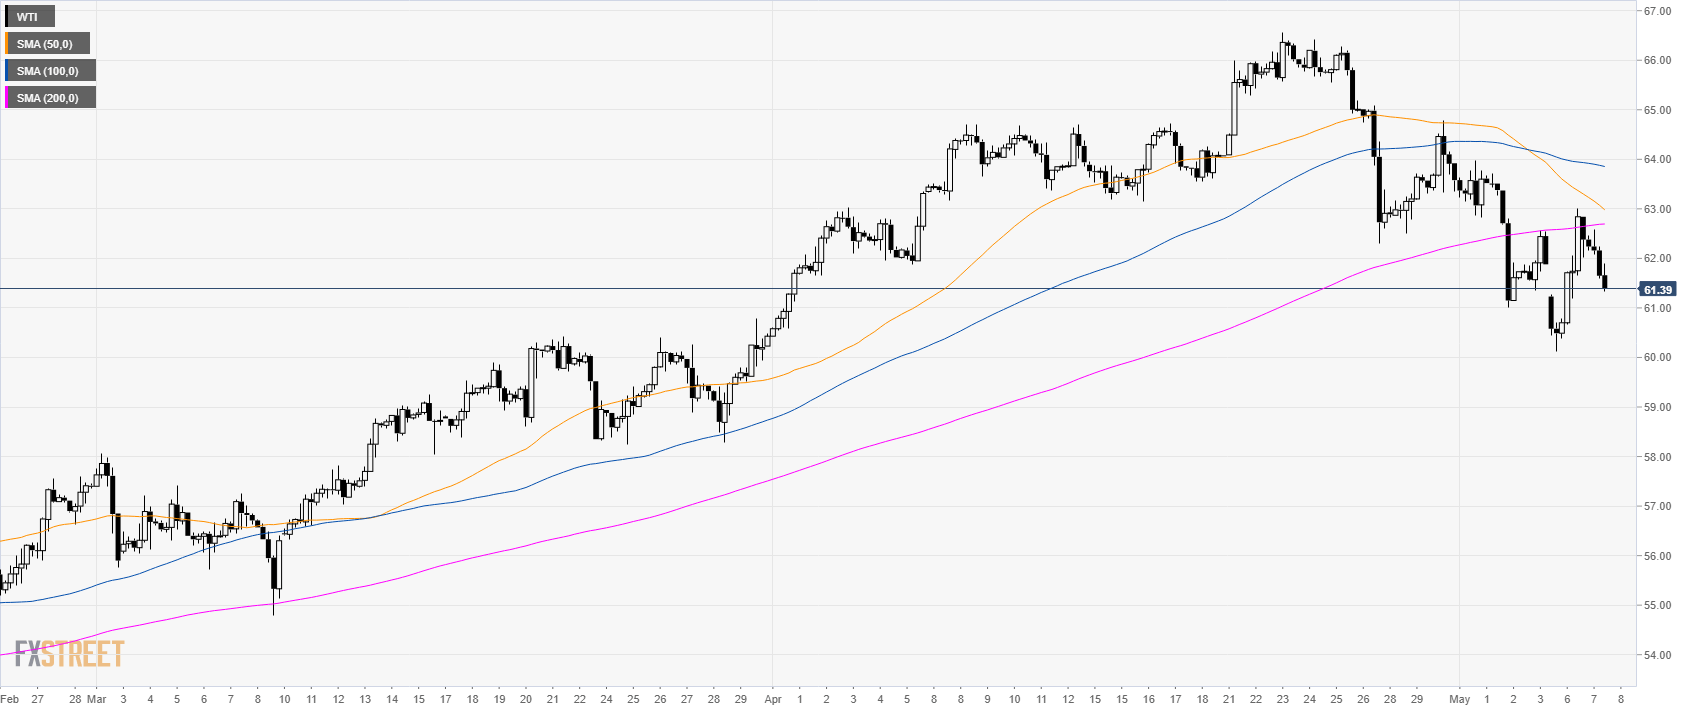
Oil 4-hour chart
- WTI is trading below its main SMAs as the market is correcting the bull breakout seen on Monday.
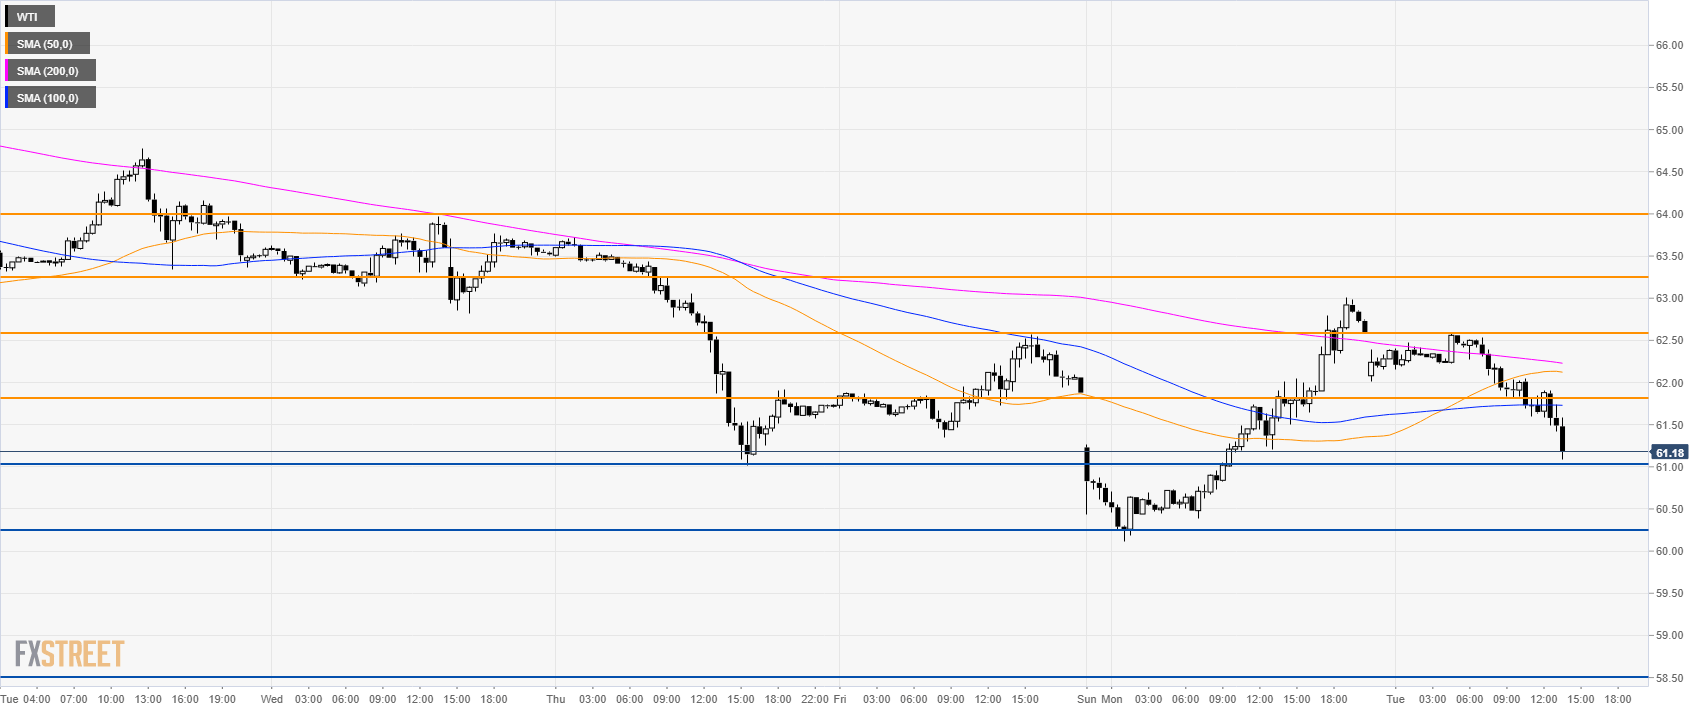
Oil 30-minute chart
- WTI is trading below its main SMAs suggesting bearish momentum in the short-term.
- Supports to the downside can be seen at 61.00 and 60.25. A break below 60.25 can lead to 58.50 support.
- Immediate resistance is at 61.80 and 62.60 level.
Additional key levels
