- The S&P500 index is on a rollercoaster. Big move up and down, high volatility.
- The market is paring some losses into the New York close.
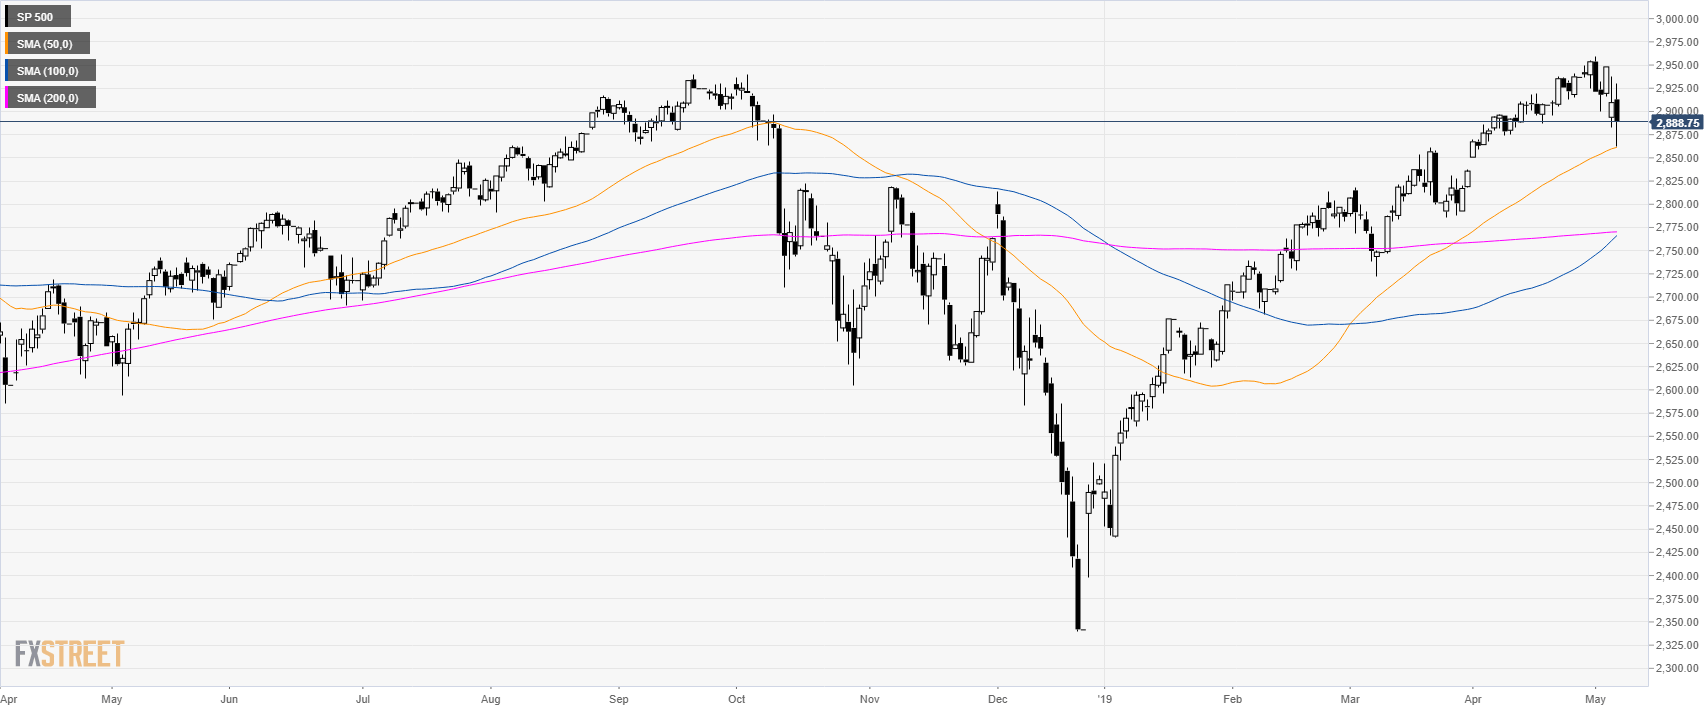
S&P500 daily chart
The S&P500 Index is trading in a bull trend above its main simple moving averages (SMAs). Bears drove the market down below the 2,900.00 figure but support was found near the 50 SMA.
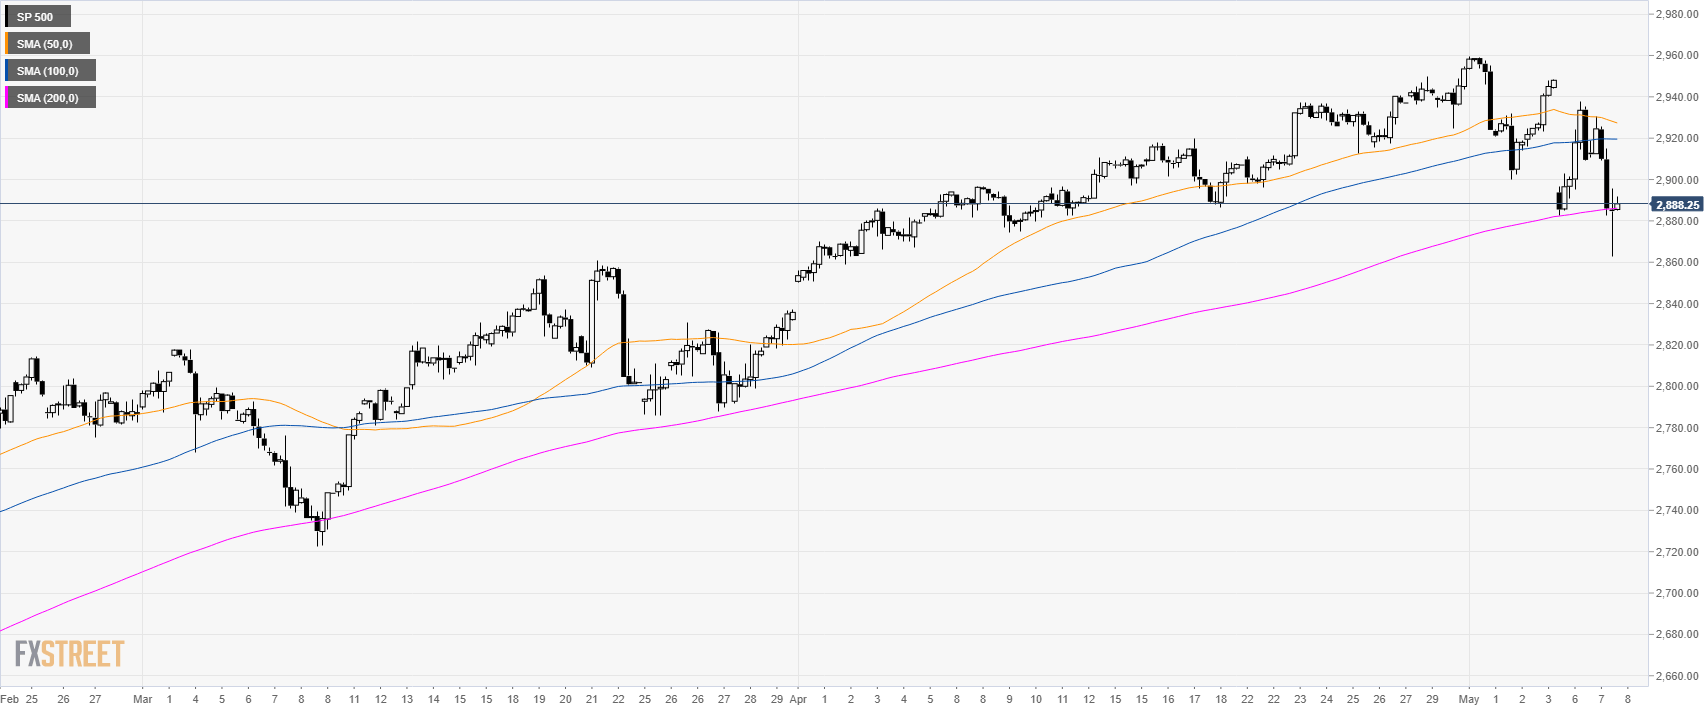
S&P500 4-hour chart
The market is stabilizing near the 200 SMA.
S&P500 30-minute chart
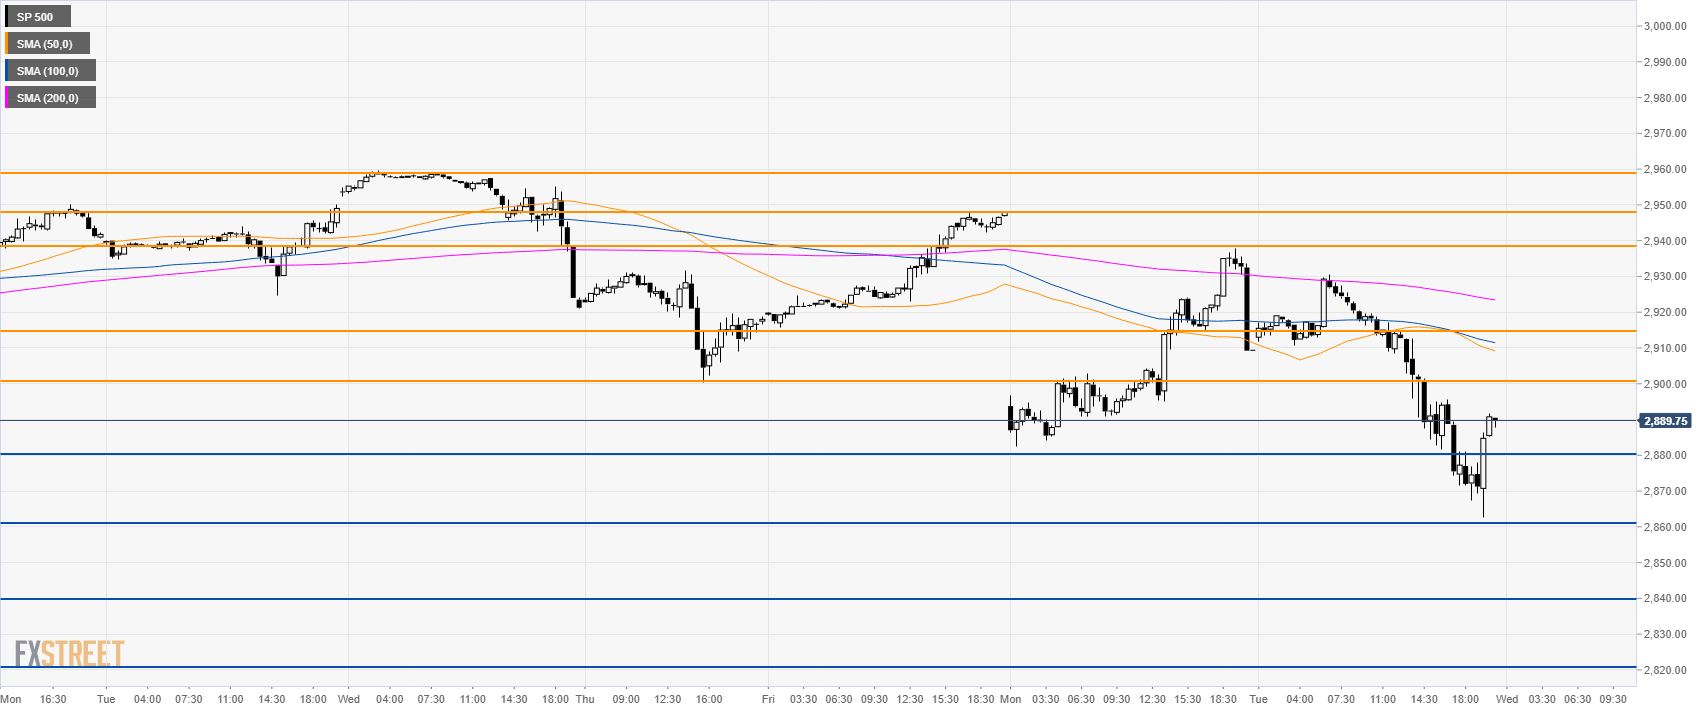
The market established another leg down below the main SMAs suggesting a bearish momentum in the short term.
Bears need to overcome 2,860.00 to reach 2,840.00 and 2,820.00 levels.
Resistance can be expected at 2,900.00, 2,915 and 2,938.00 levels.

Additional key levels
