- Cable is trading at daily lows and attempting to break the 1.3000 figure.
- Brexit drama continues to weigh on the Pound.
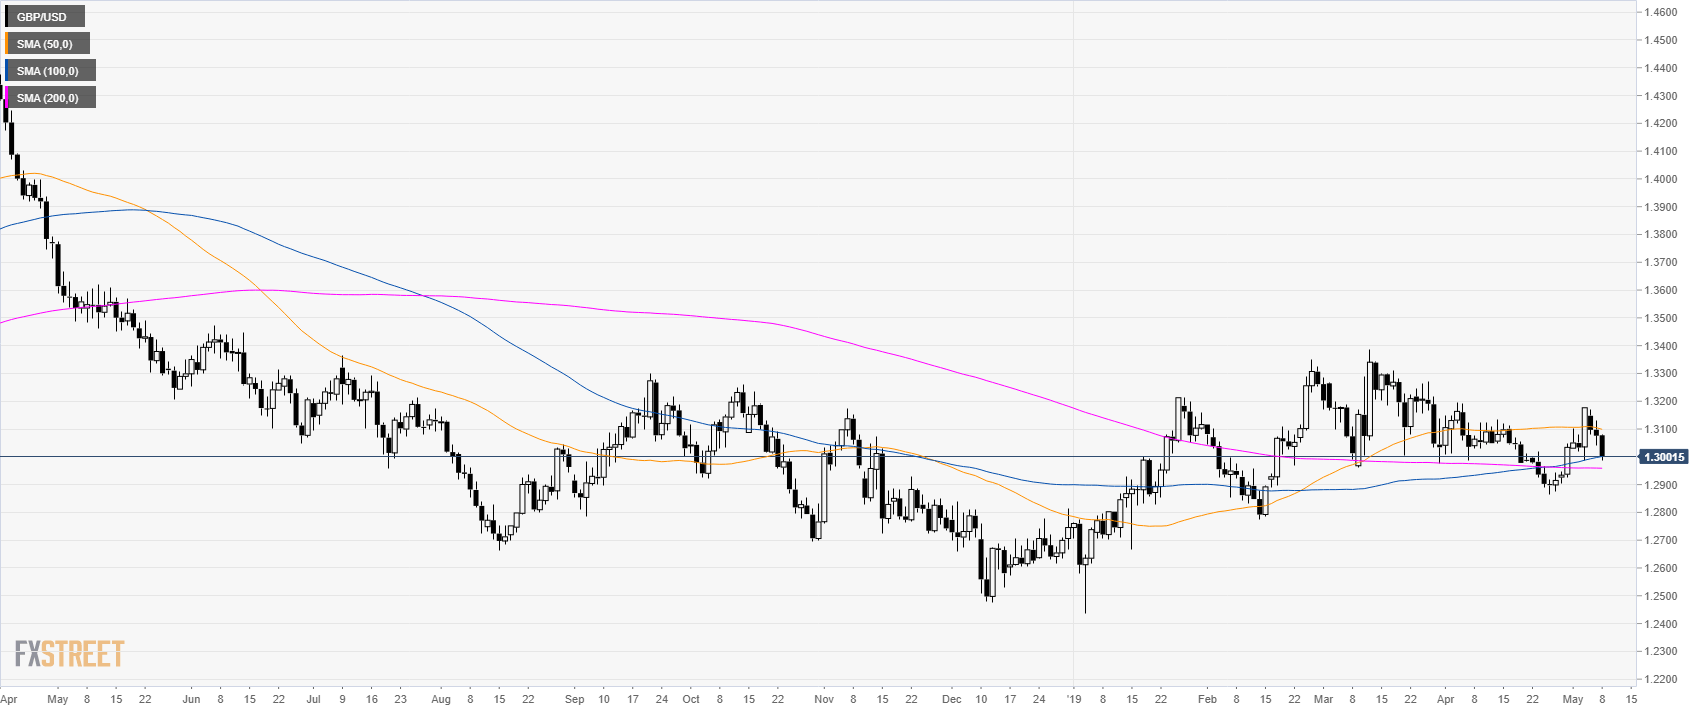
GBP/USD daily chart
GBP/USD is down for the third consecutive days as as the United Kingdom’s government and the opposition have been unable to reach an agreement.
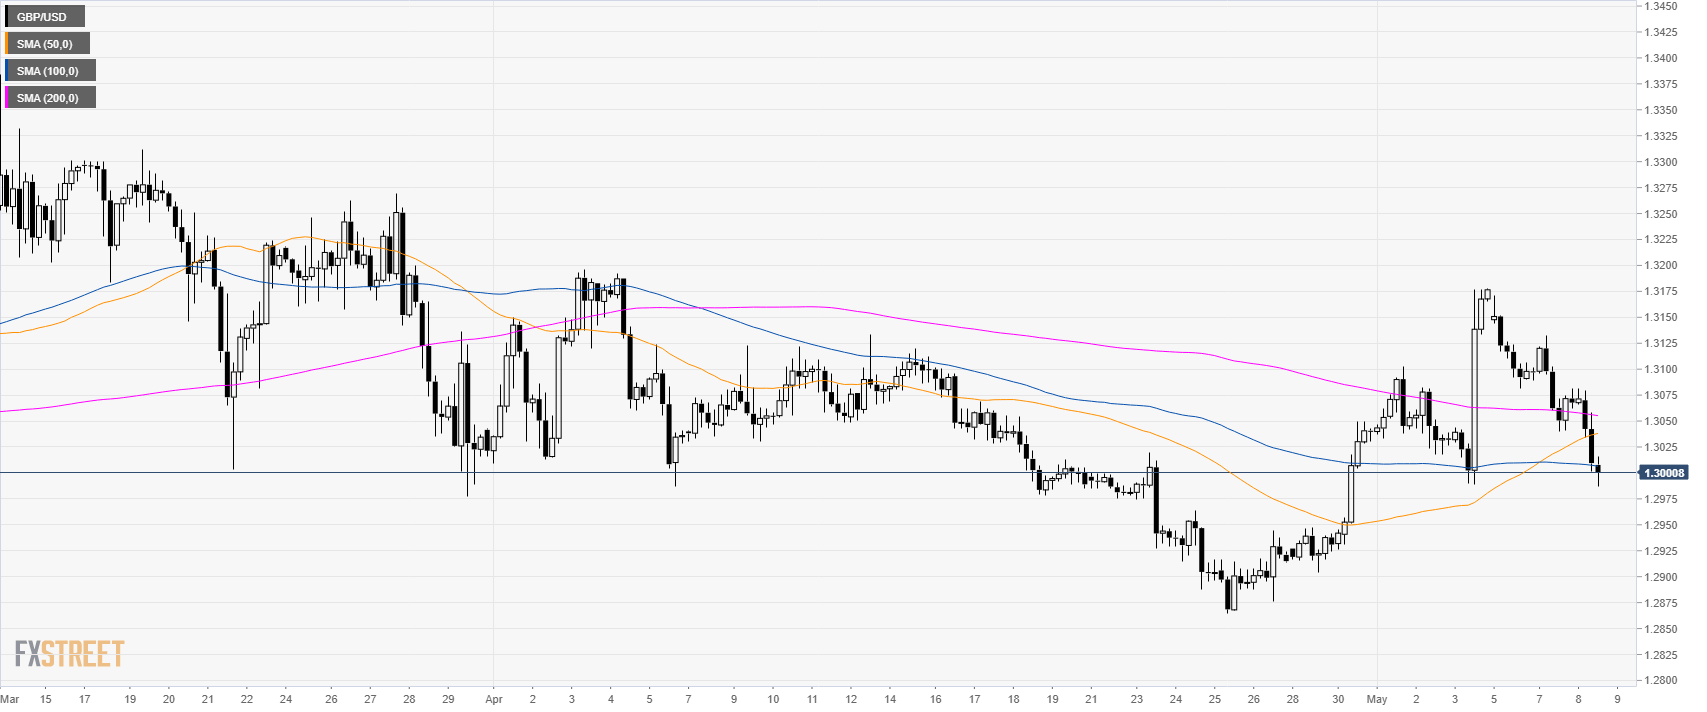
GBP/USD 4-hour chart
Bears have erased the gains made last Friday on the US Nonfarm Payrolls.
GBP/USD is trading below its main SMAs suggesting bearish momentum in the medium term.
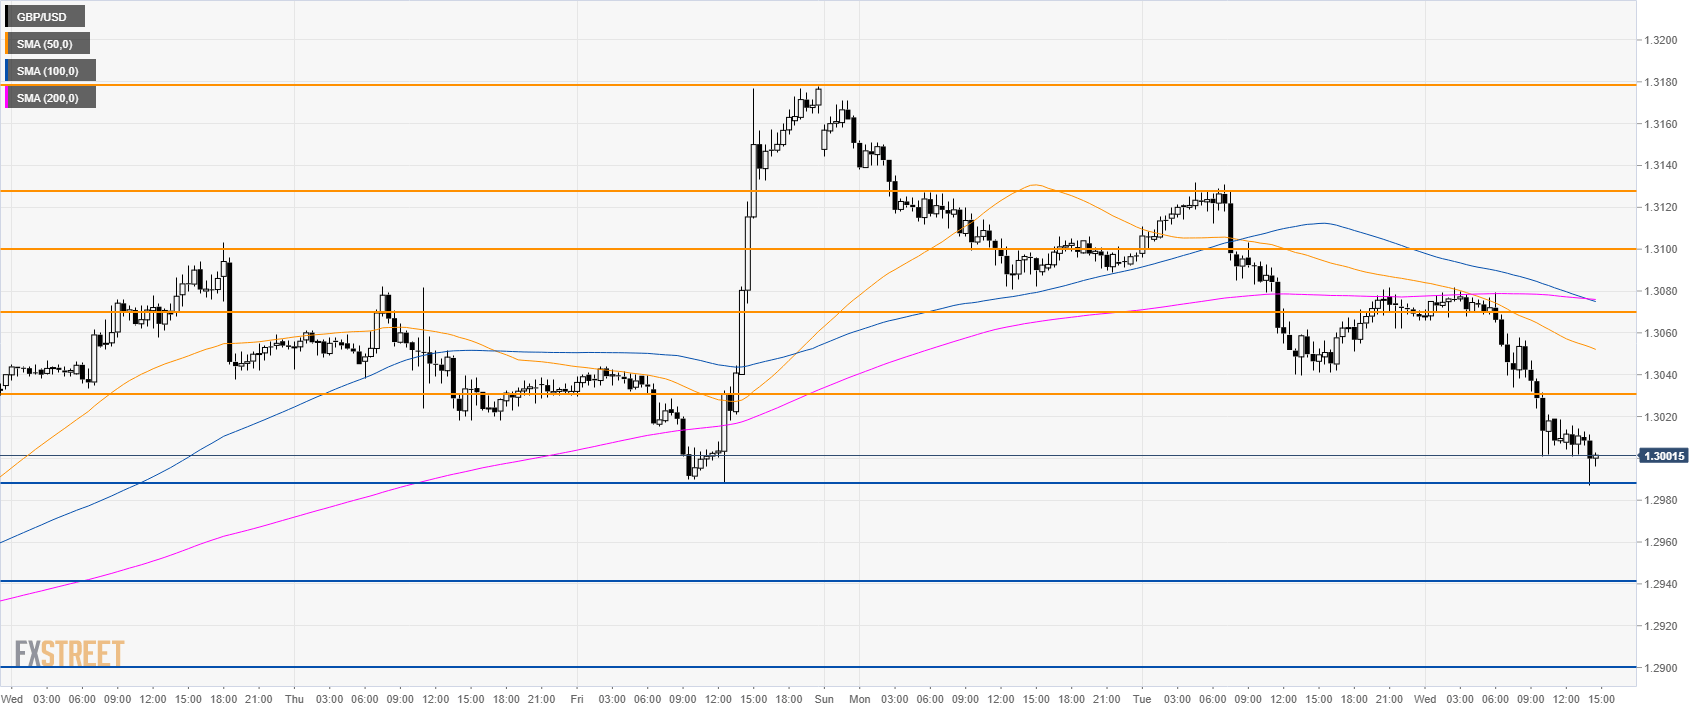
GBP/USD 30-minute chart
GBP/USD is trading below its main SMAs suggesting bearish momentum in the short-term.
If bears can break 1.2990 support then 1.2940 and 1.2900 figure can be on the cards for sellers.
Immediate resistances are at 1.3030 and 1.3070 level.
Additional key levels
