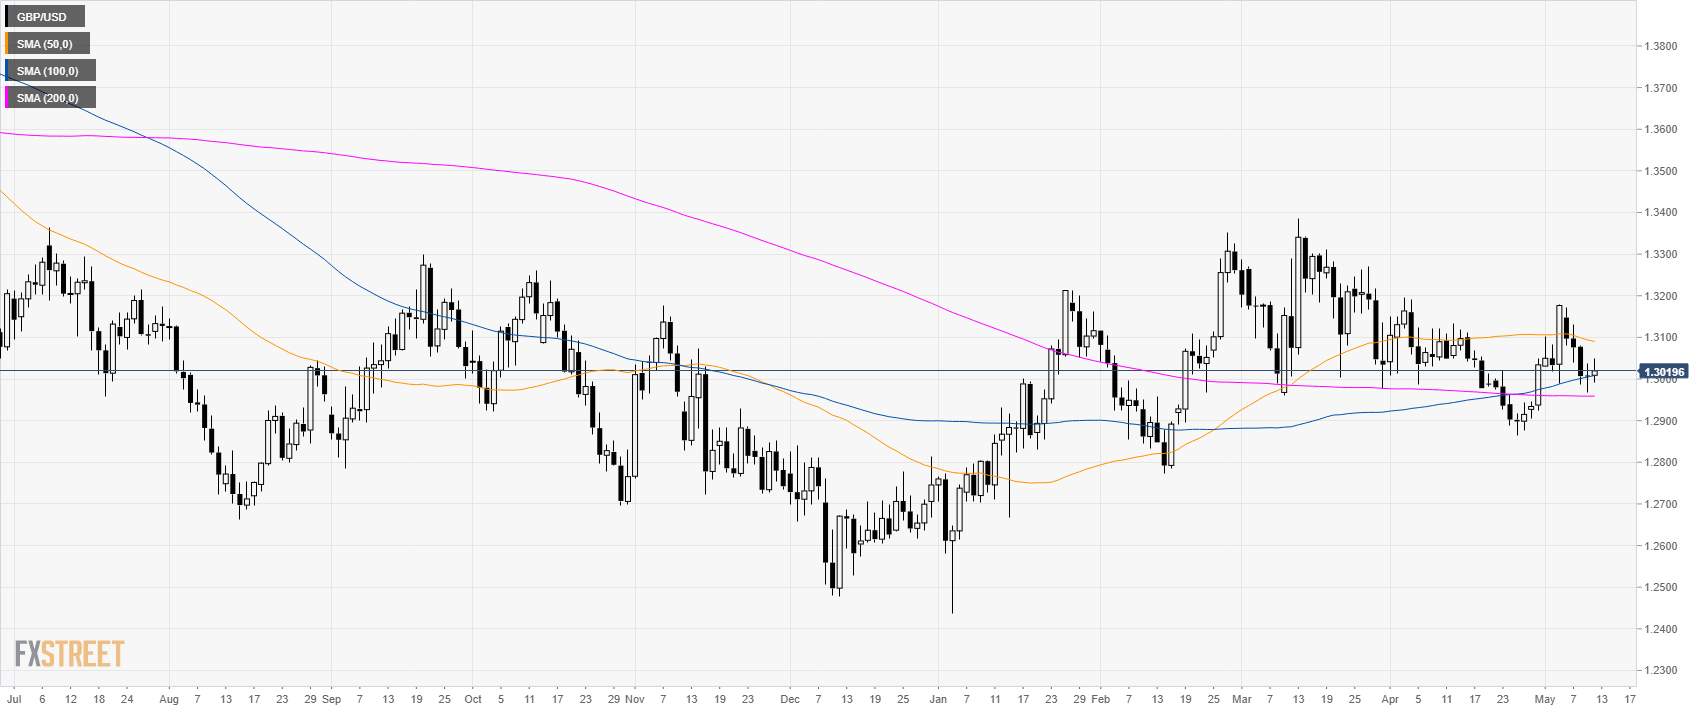
GBP/USD daily chart
GBP/USD is trading within familiar ranges above the 1.3000 figure.
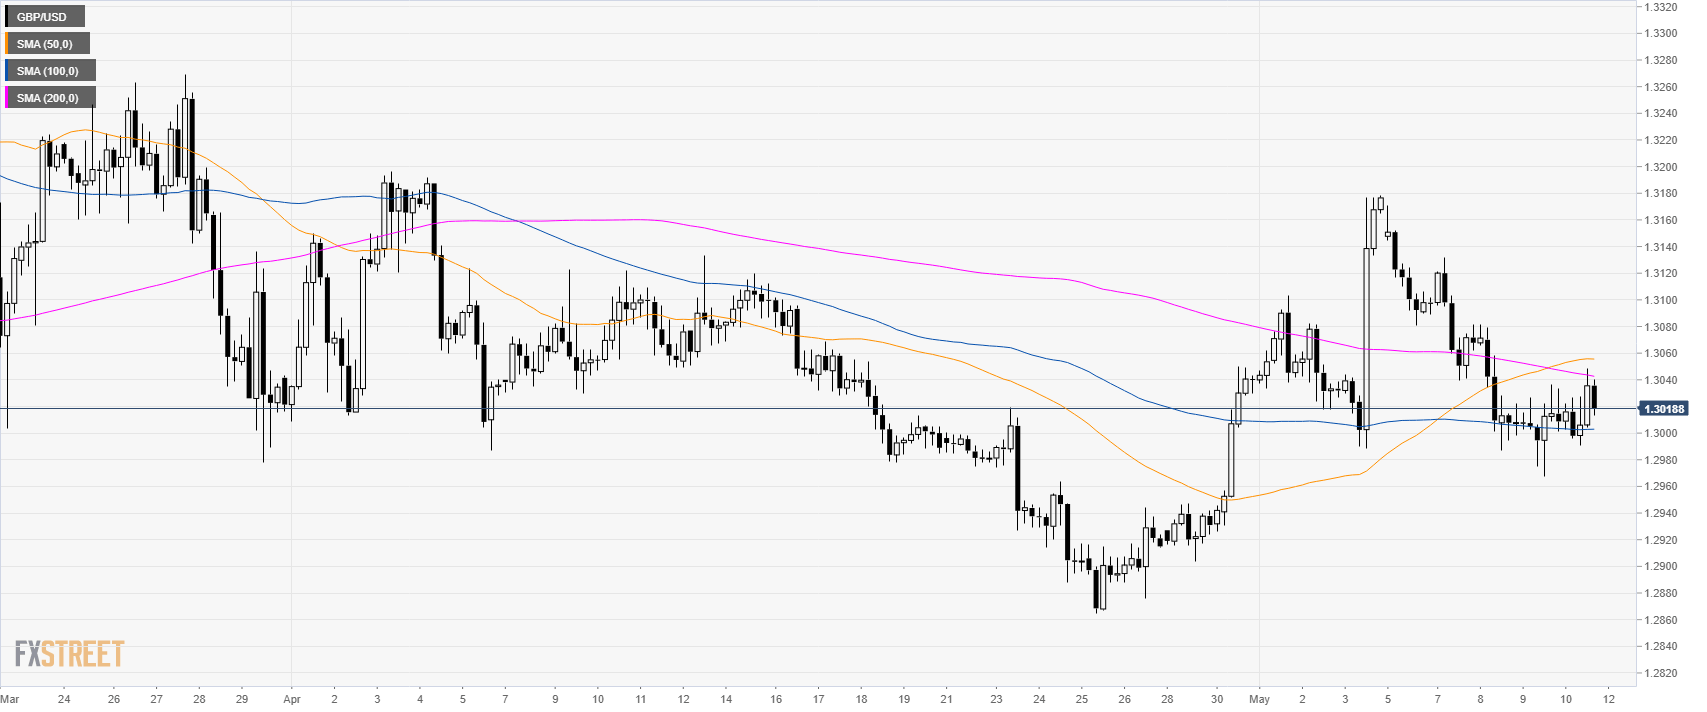
GBP/USD 4-hour chart
Cable is chopping between the 100 and 200 SMA as investors are waiting for the next catalyst.
GBP/USD 30-minute chart
The picture is mixed as Cable is consolidating between 1.2990 and 1.3050 resistance. Bears currently have the lead and might revisit 1.2990. A beak below this level can lead to 1.2940 in the short-term.
Looking to the upside, 1.3050 is a strong resistance, if broken price can escalate towards 1.3070, 1.3100 and 1.3130 resistances.
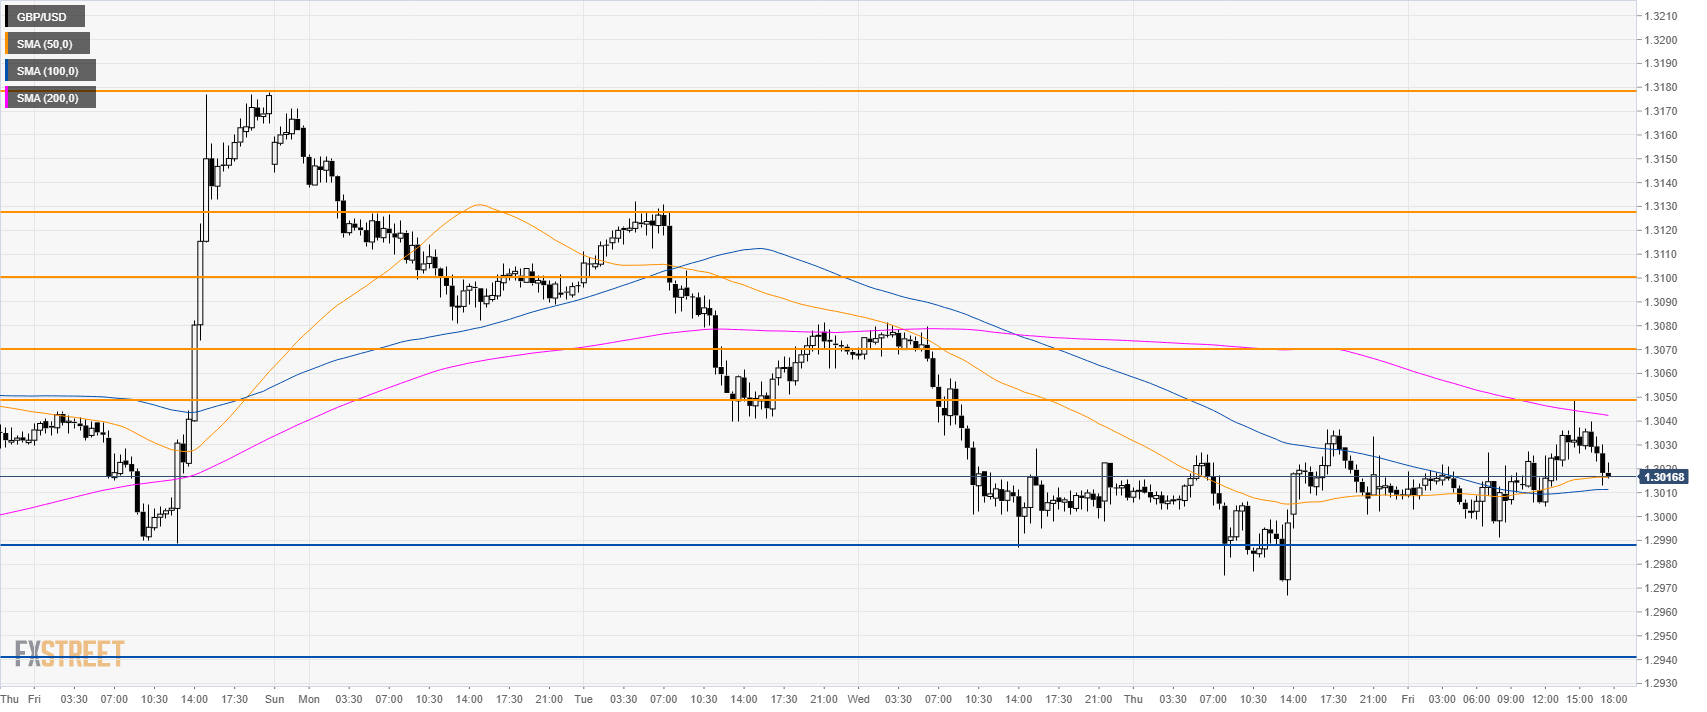
Additional key levels
