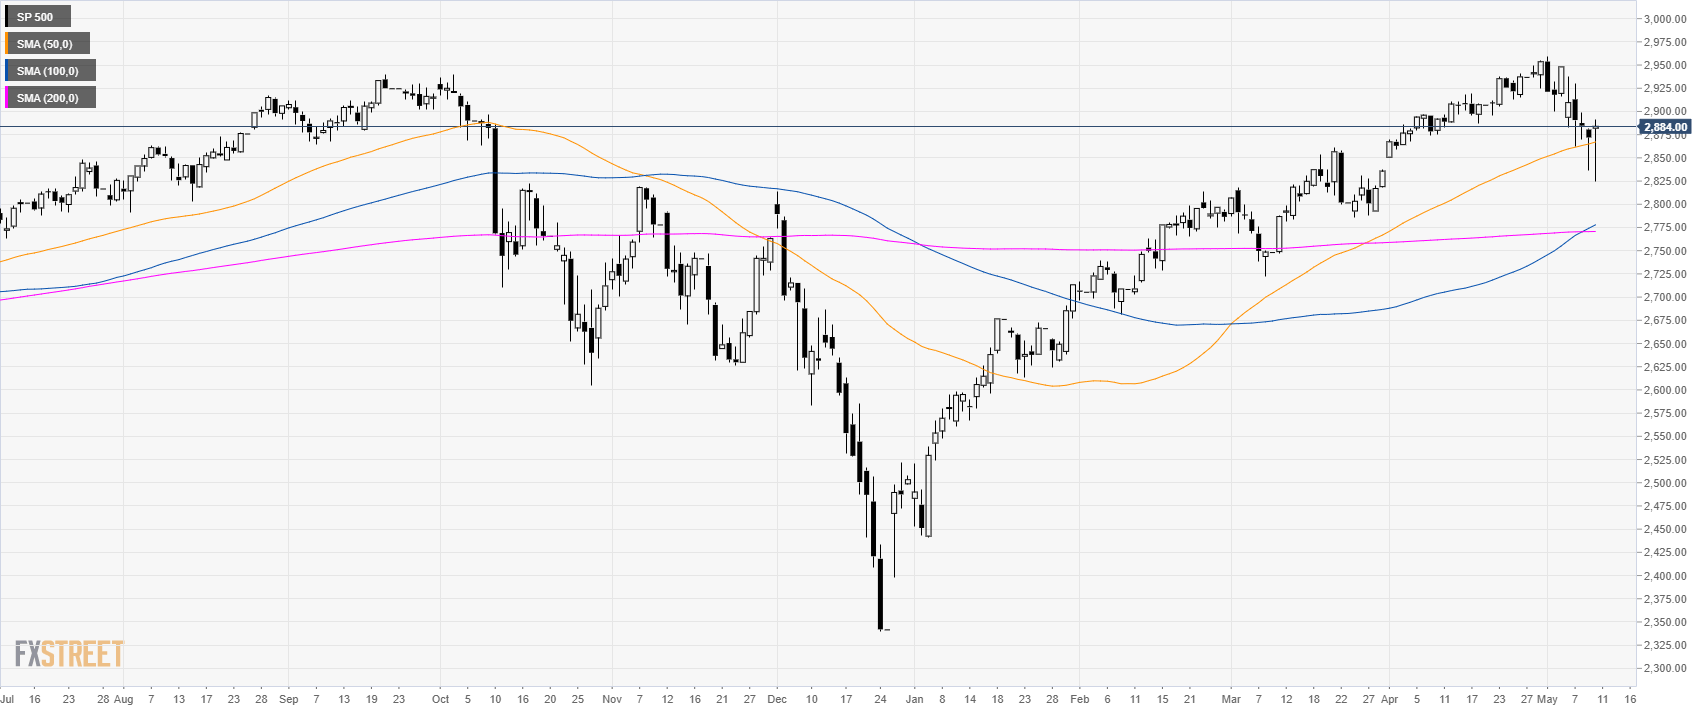
S&P500 daily chart
The S&P500 Index is trading in a bull trend above its main simple moving averages (SMAs). The market dropped to 2,825.00 and closed above the 50 SMA.
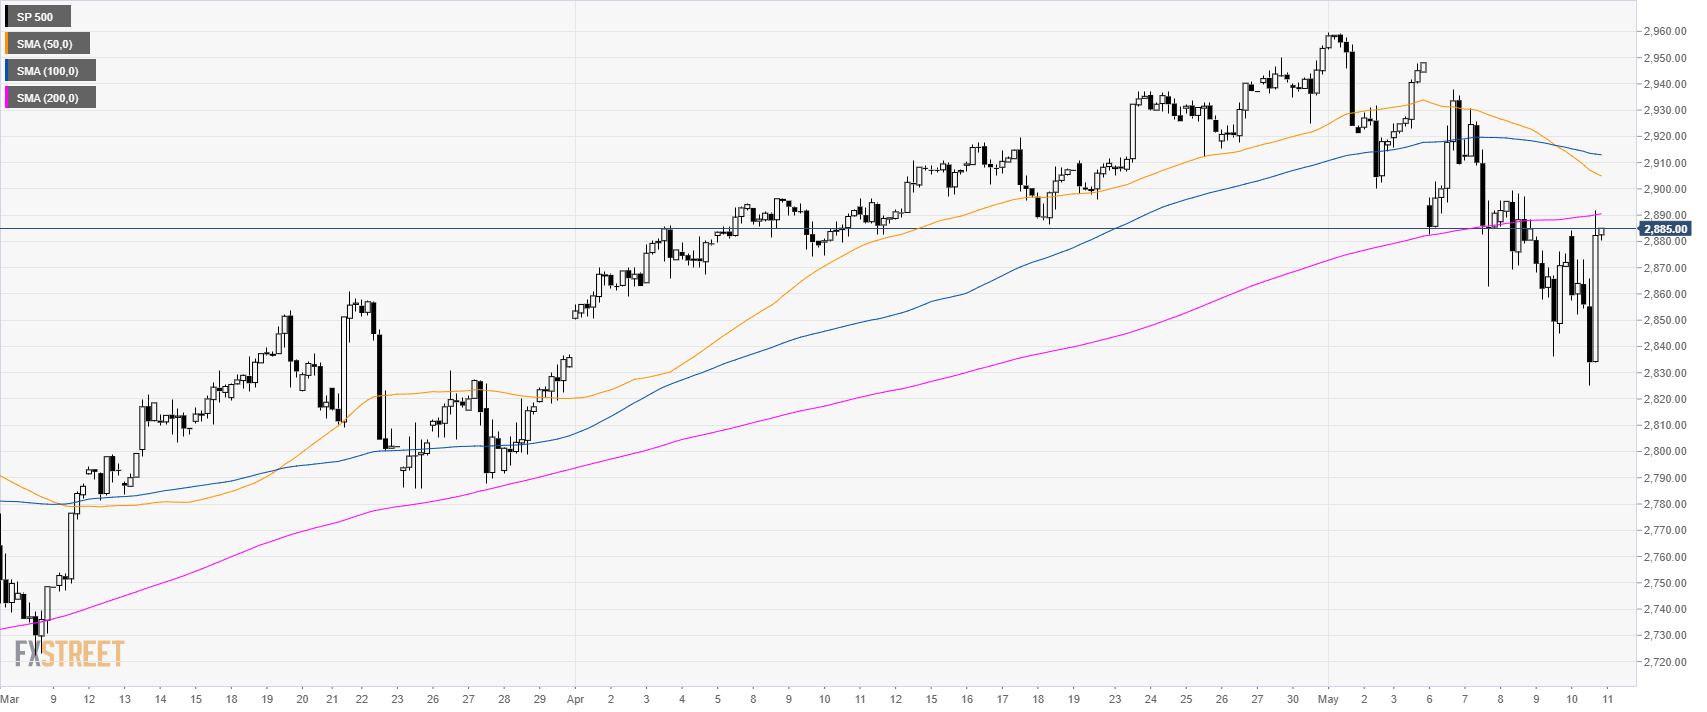
S&P500 4-hour chart
The market is trading below the main SMAs suggesting bearish pressure in the medium term.
The S&P500 tested 2,890.00 and the 200 SMA.
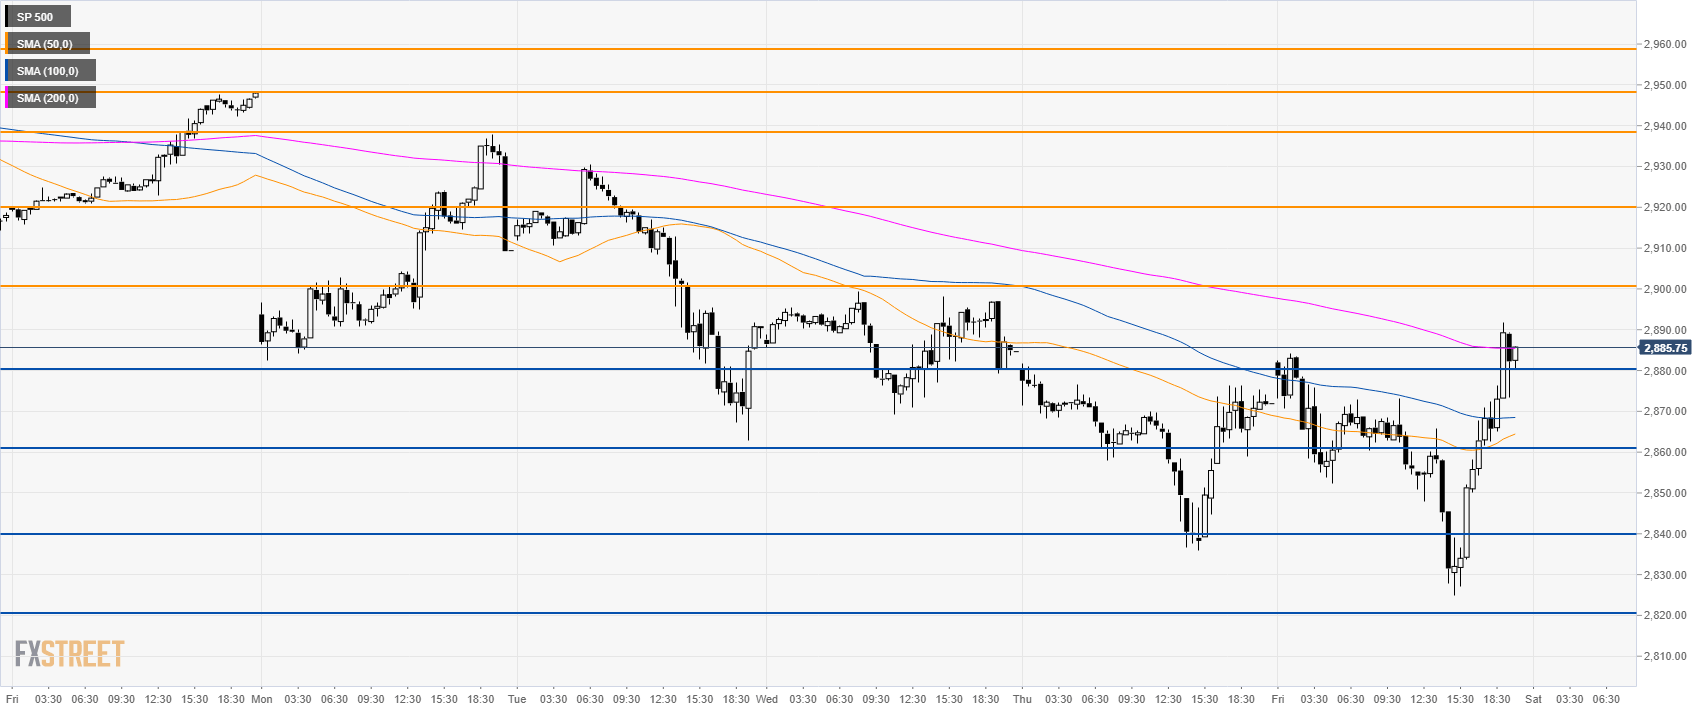
S&P500 30-minute chart
The bulls reversed the daily losses as they drove the market above 2,880.00 into the close. If the market can break above 2,900.00 then 2,920.00 can come into play.
Supports are at 2,860.00 and 2,840.00 levels
Additional key levels
