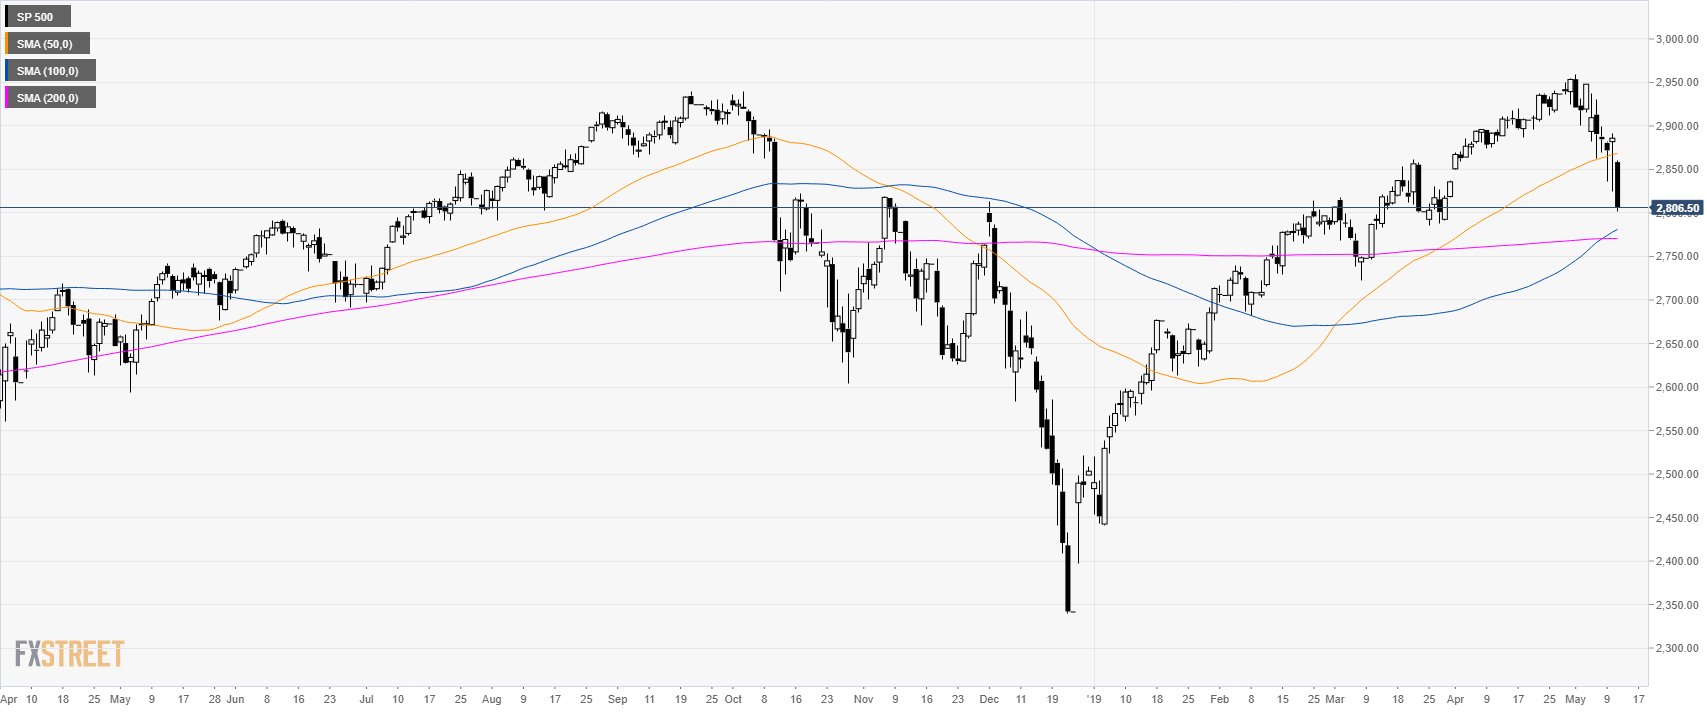
S&P500 daily chart
The S&P500 Index is trading in a bull trend above its 200-period simple moving averages (SMA). The market is retracing down sharply as China imposed tariffs on the US sending a wave of fear in the financial markets.
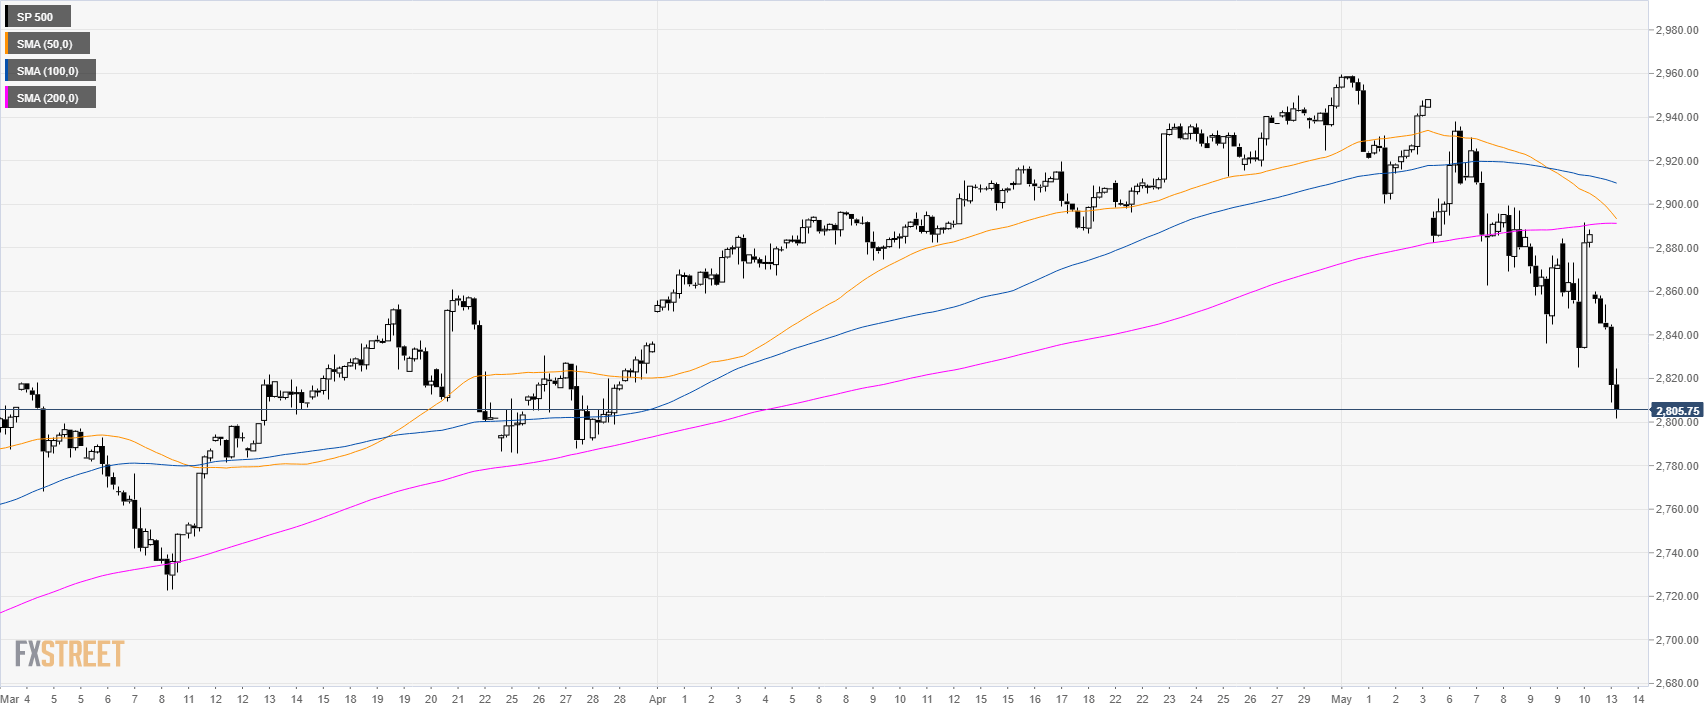
S&P500 4-hour chart
The market is trading below the main SMAs suggesting bearish pressure in the medium term.
The S&P500 almost reached the 2,800.00 figure.
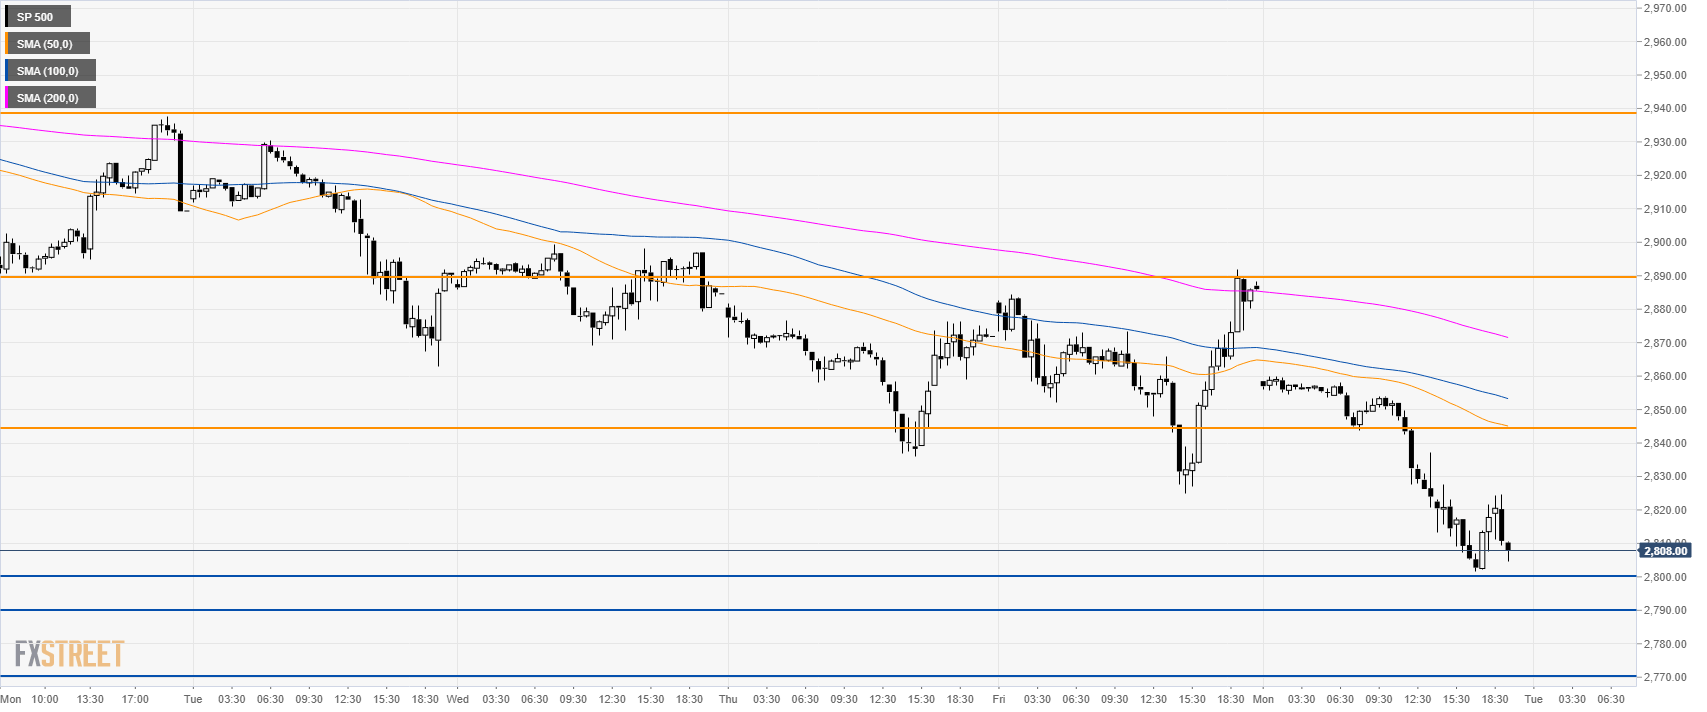
S&P500 30-minute chart
The index is trading below its main SMAs suggesting bearish momentum in the short term.
Bears will need to overcome 2,800.00-2,790.00 support to potentially drive the market to 2,770.00 and 2,730.00 levels.
Alternatively, if 2,790.00 holds, bulls can look at the 2,850.00 and 2,890.00 resistances as potential targets.
Additional key levels
