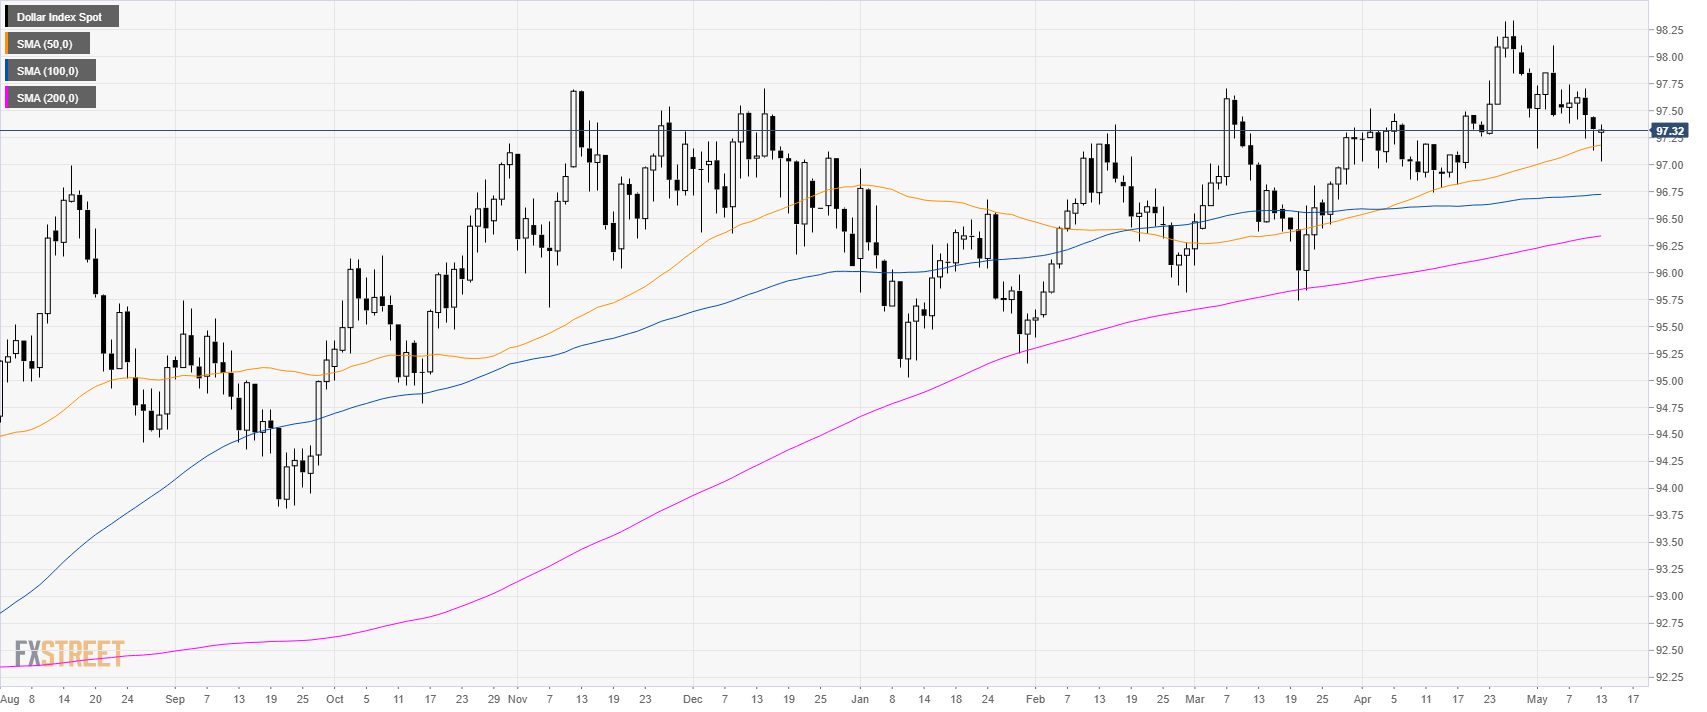
DXY daily chart
The US Dollar Index (DXY) is trading in a bull trend above its main simple moving averages (SMAs).
97.18 where lies the 50 SMA and the 97.00 figure provided support this Monday.
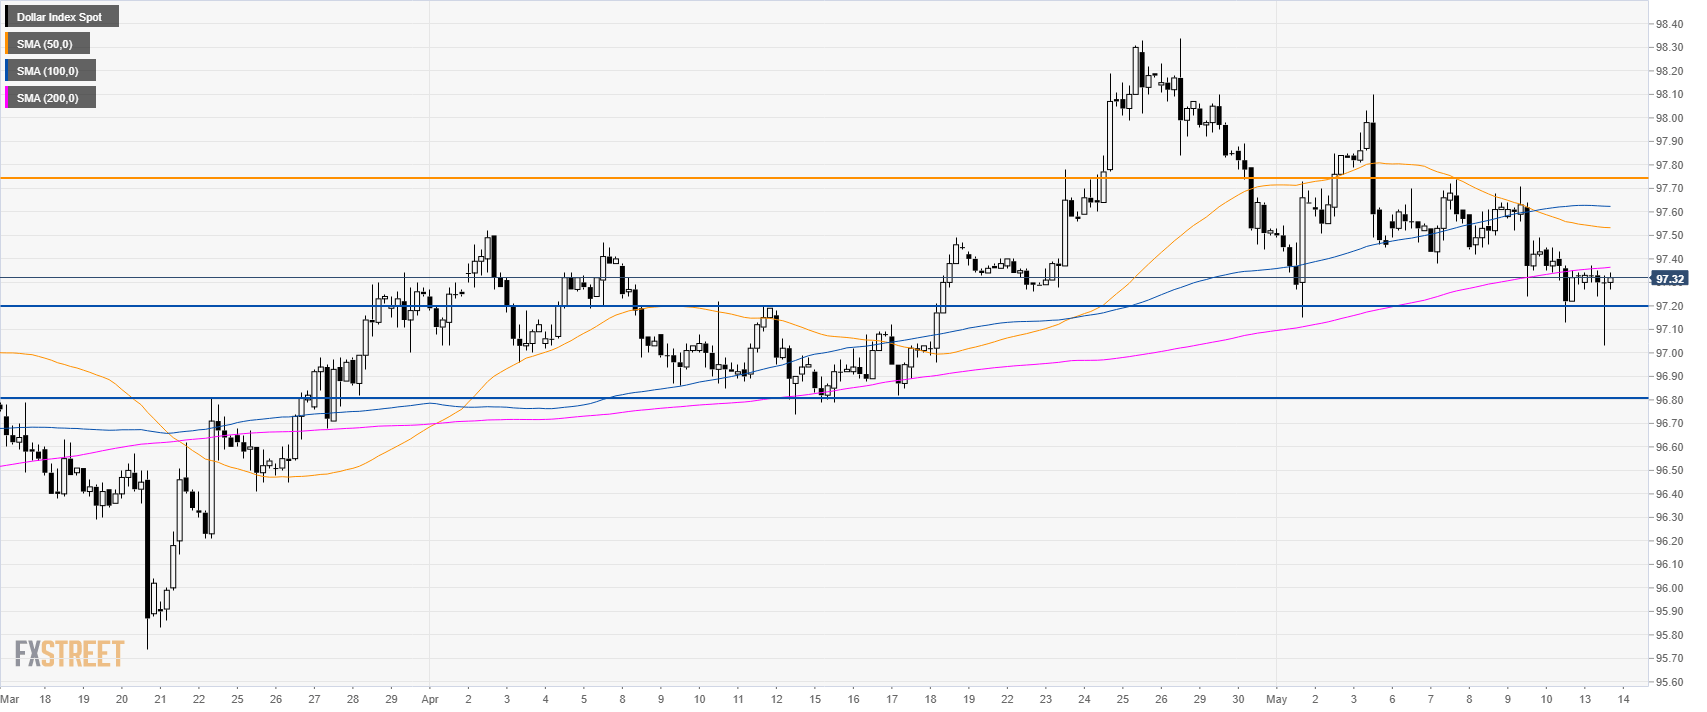
DXY 4-hour chart
DXY trades above 97.20 key support held on Monday. Bulls will need to initially overcome 97.35 resistance in order to potentially 97.74 key resistance to the upside.
A sustained beach below 97.20/97.00 would negate the bullish scenario as the main support on the way down is seen at 96.80.
DXY 30-minute chart
Bulls created a v-shaped reversal on Monday while the bulls are challenging the 100 SMA.
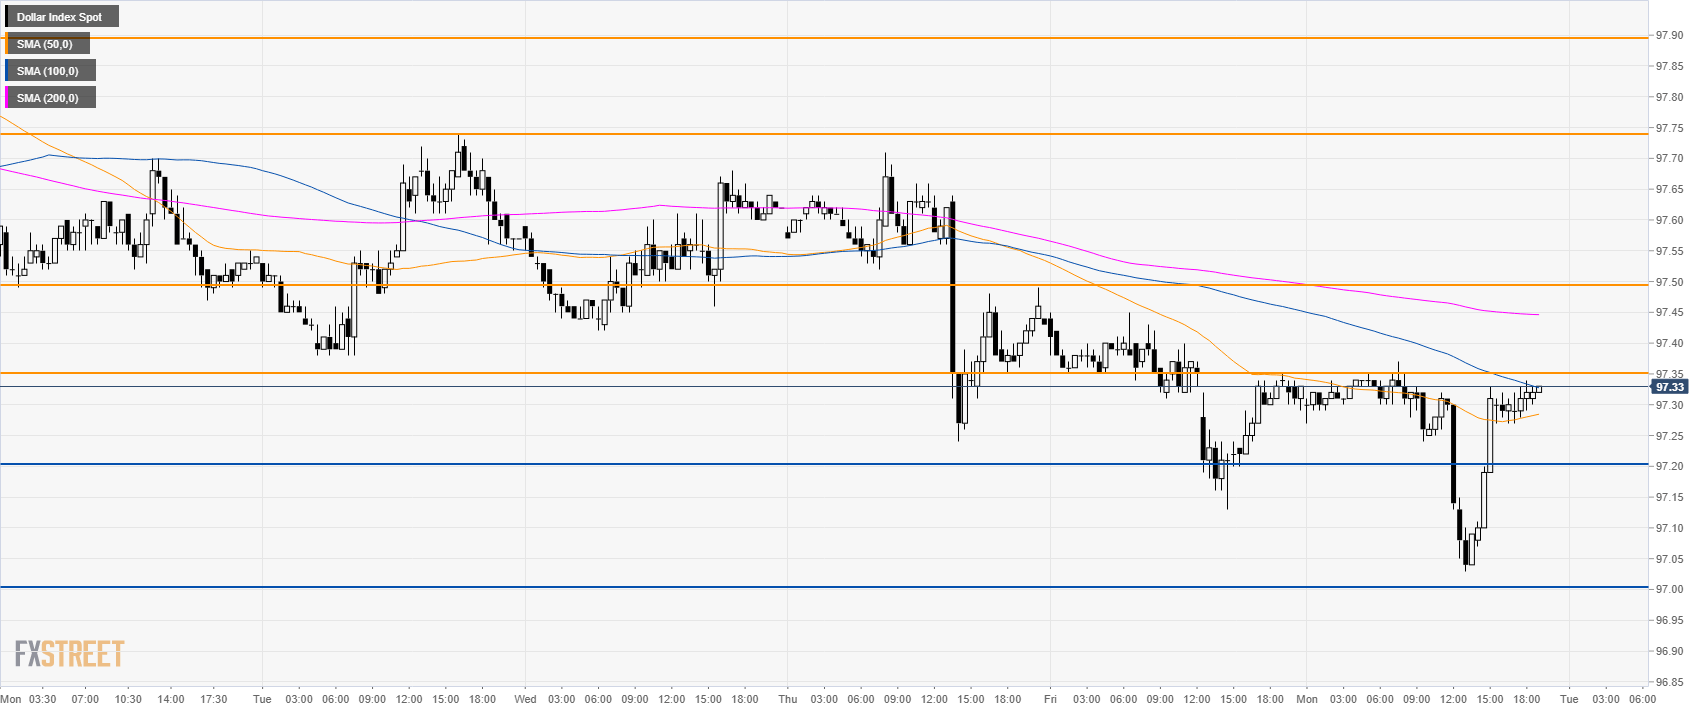
Additional key levels
