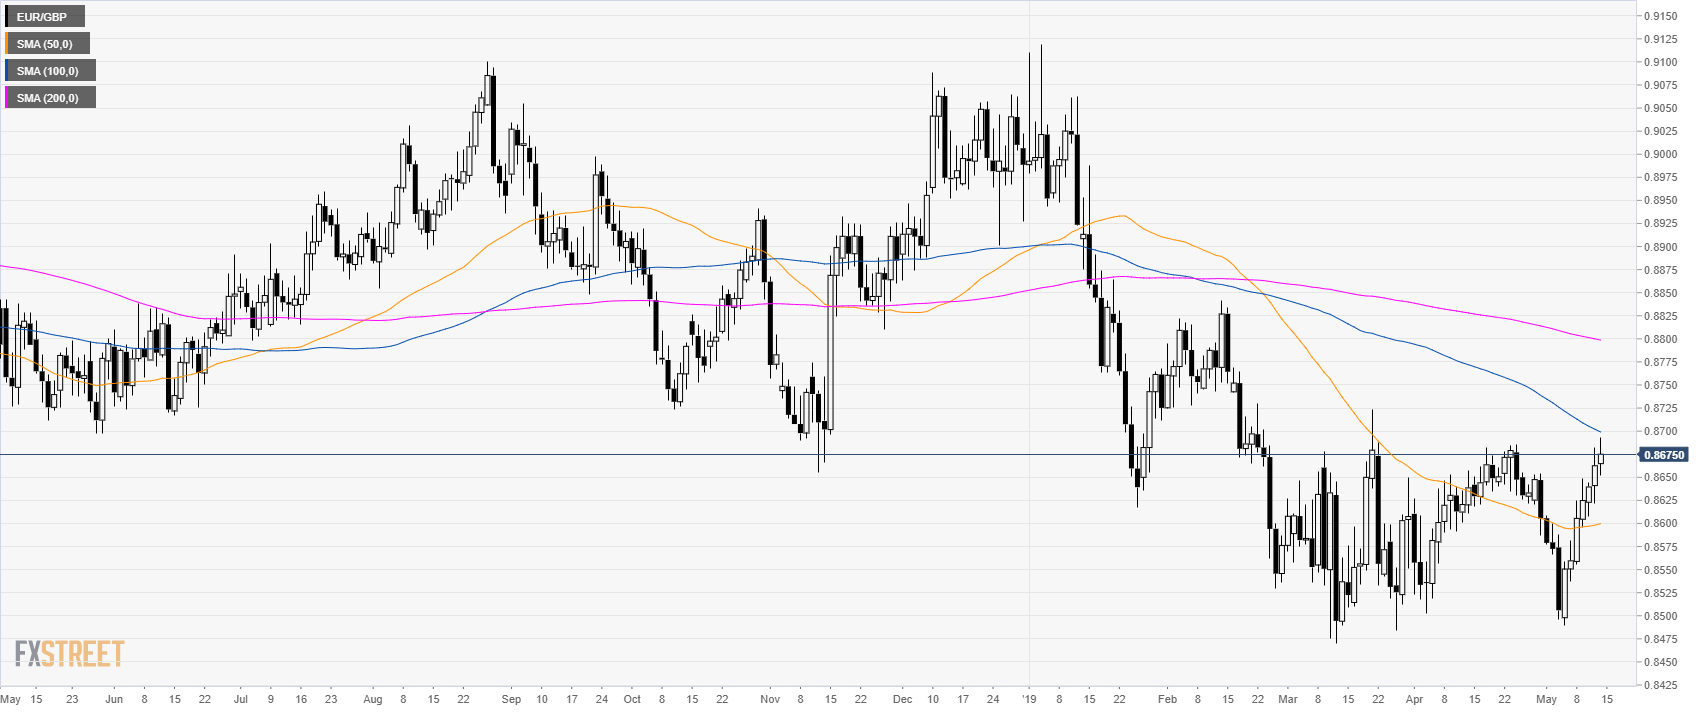
EUR/GBP daily
On the daily picture, EUR/GBP is trading in a bear leg below its 100 and 200 simple moving averages (SMAs).
However, EUR/GBP is reversing up sharply as it has been up for 7 consecutive days.
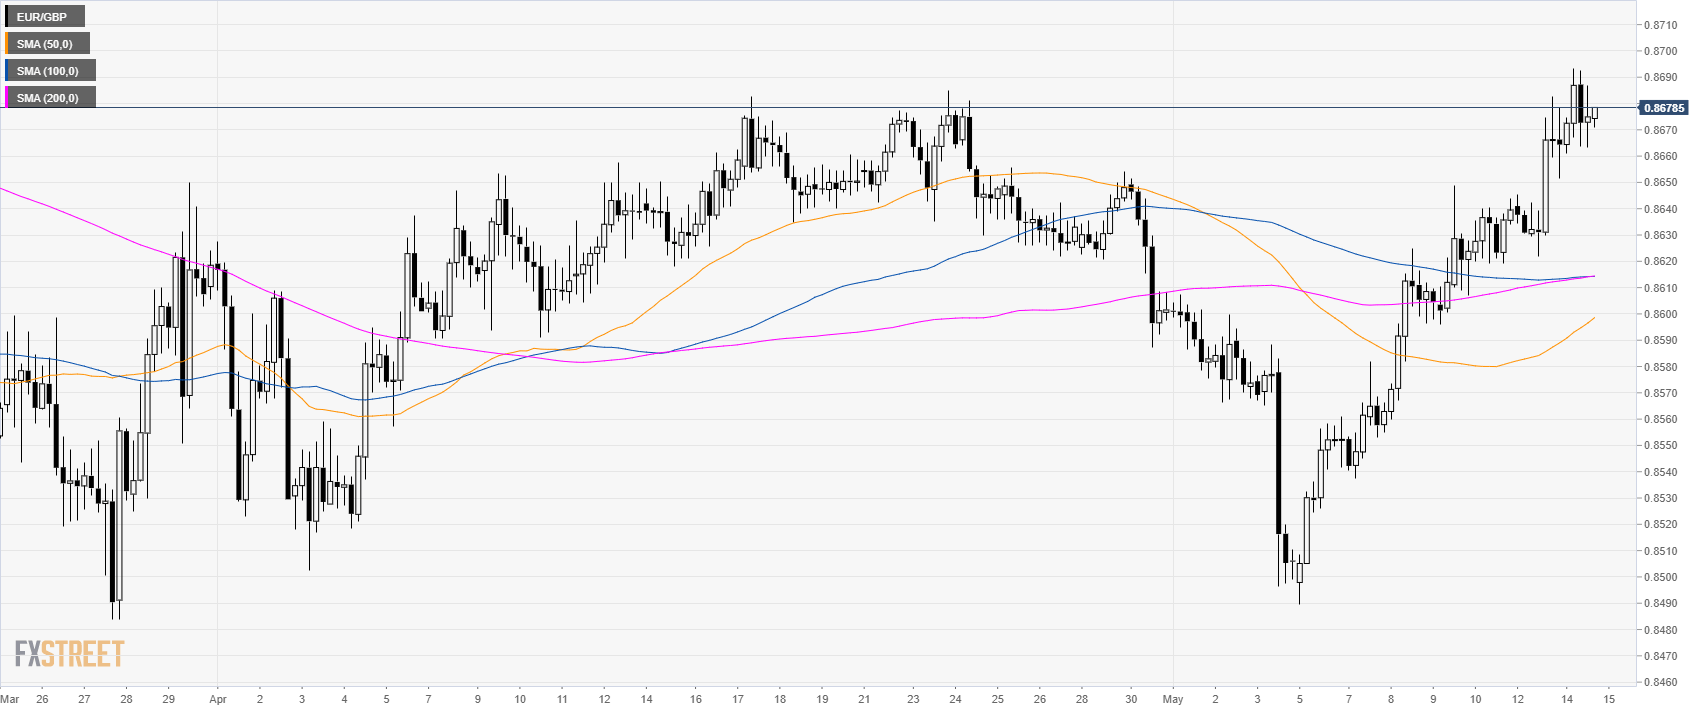
EUR/GBP 4-hour chart
EUR/GBP is spiking up above April’s high and the main SMAs.
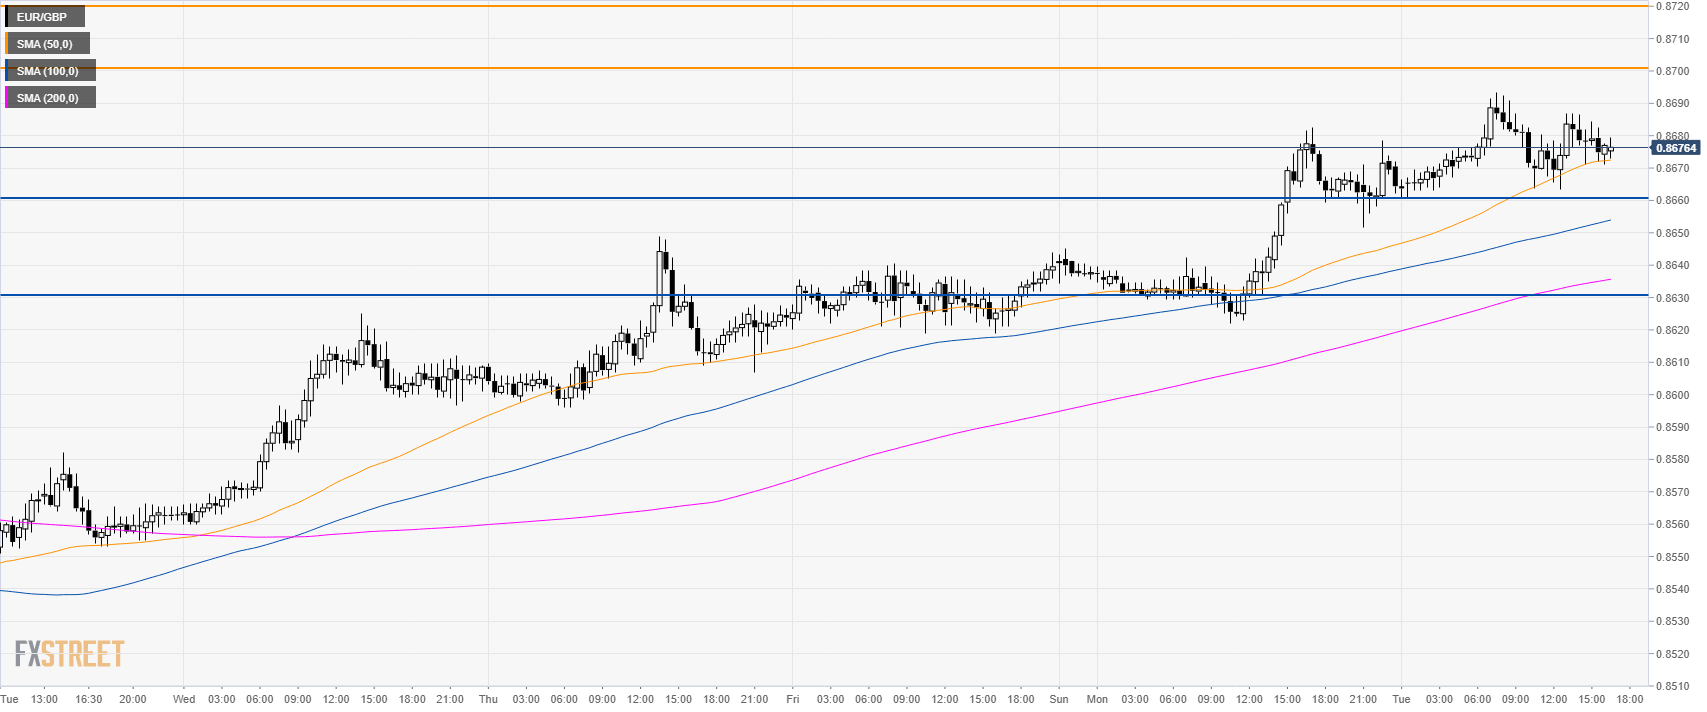
EUR/GBP 30-minute chart
EUR/GBP is trading above its main SMAs suggesting bullish momentum. The next hurdle for bulls is seen at the 0.8700 figure. If broken, then buyers can set their eyes on 0.8720 and the 0.8750 level.
Alternatively a breach below, 0.8660 support can lead to the 0.8630 price level.
Additional key levels
