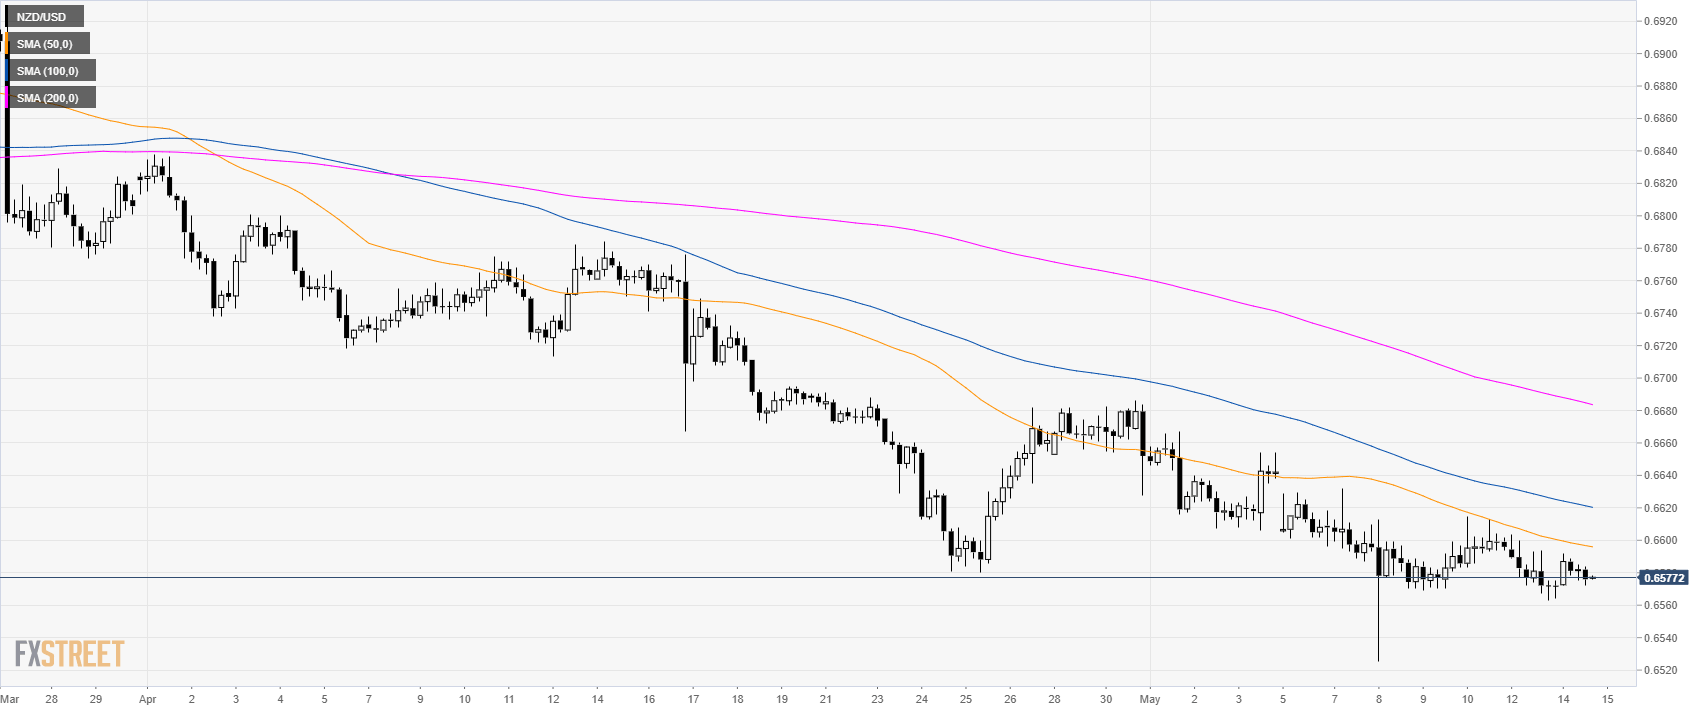
NZD/USD daily chart
NZD/USD is trading in a bear trend below the 0.6600 handle and its main simple moving averages (SMAs).

NZD/USD 4-hour chart
NZD/USD is trading below its main SMAs suggesting bearish momentum in the medium term.
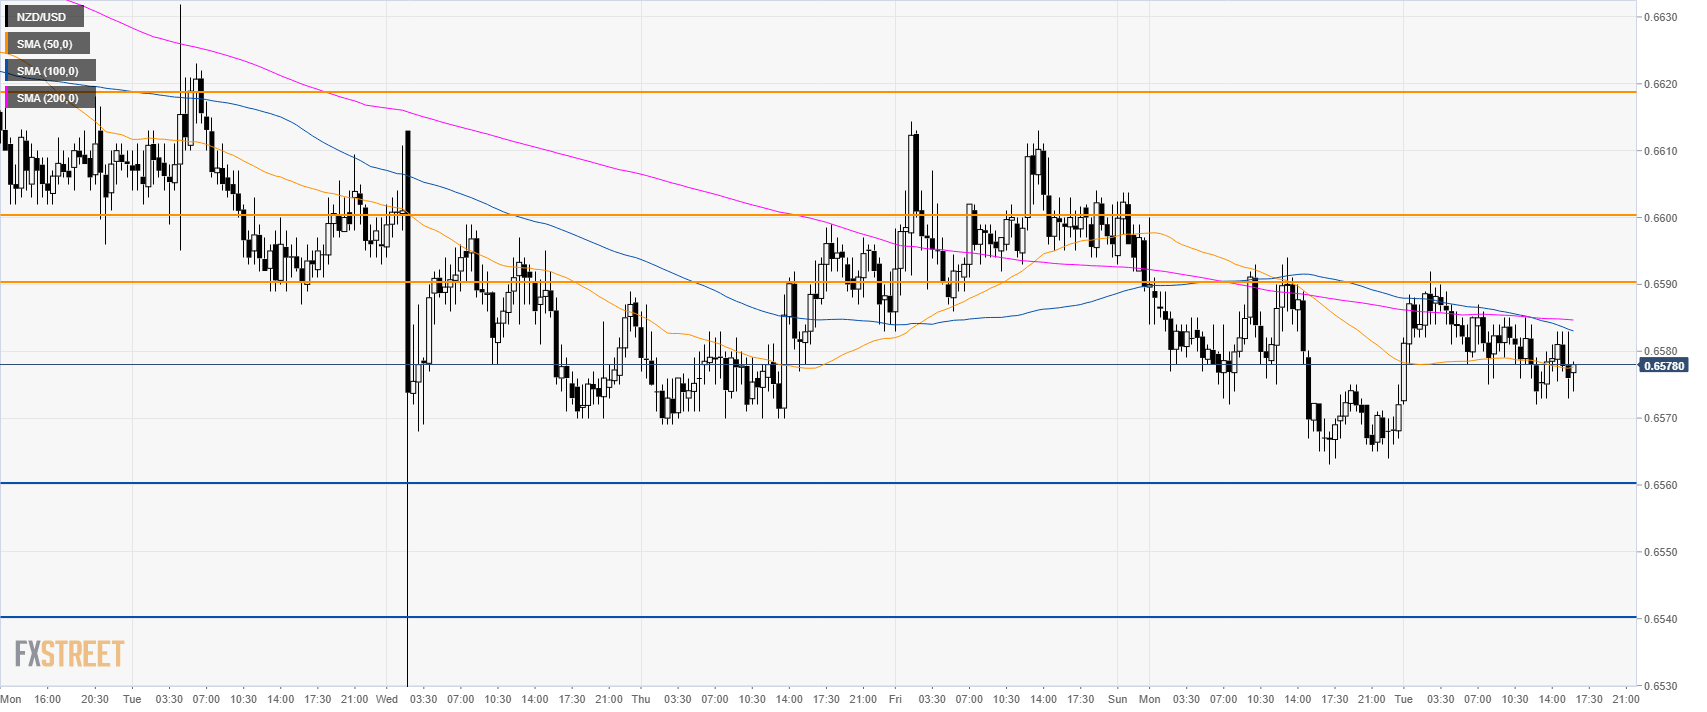
NZD/USD 30-minute chart
NZD/USD is trading in a tight range below its main SMAs inside Monday’s range suggesting a sideways to down market in the short term.
The picture is quite unclear as the market can breakout in either direction. Bulls would need to break above 0.6890 to climb to the 0.6600 figure and 0.6620 level.
On the other hand, bears would need a break below 0.6560 on a daily closing basis to move down to the 0.6540 support level.
Additional key levels
