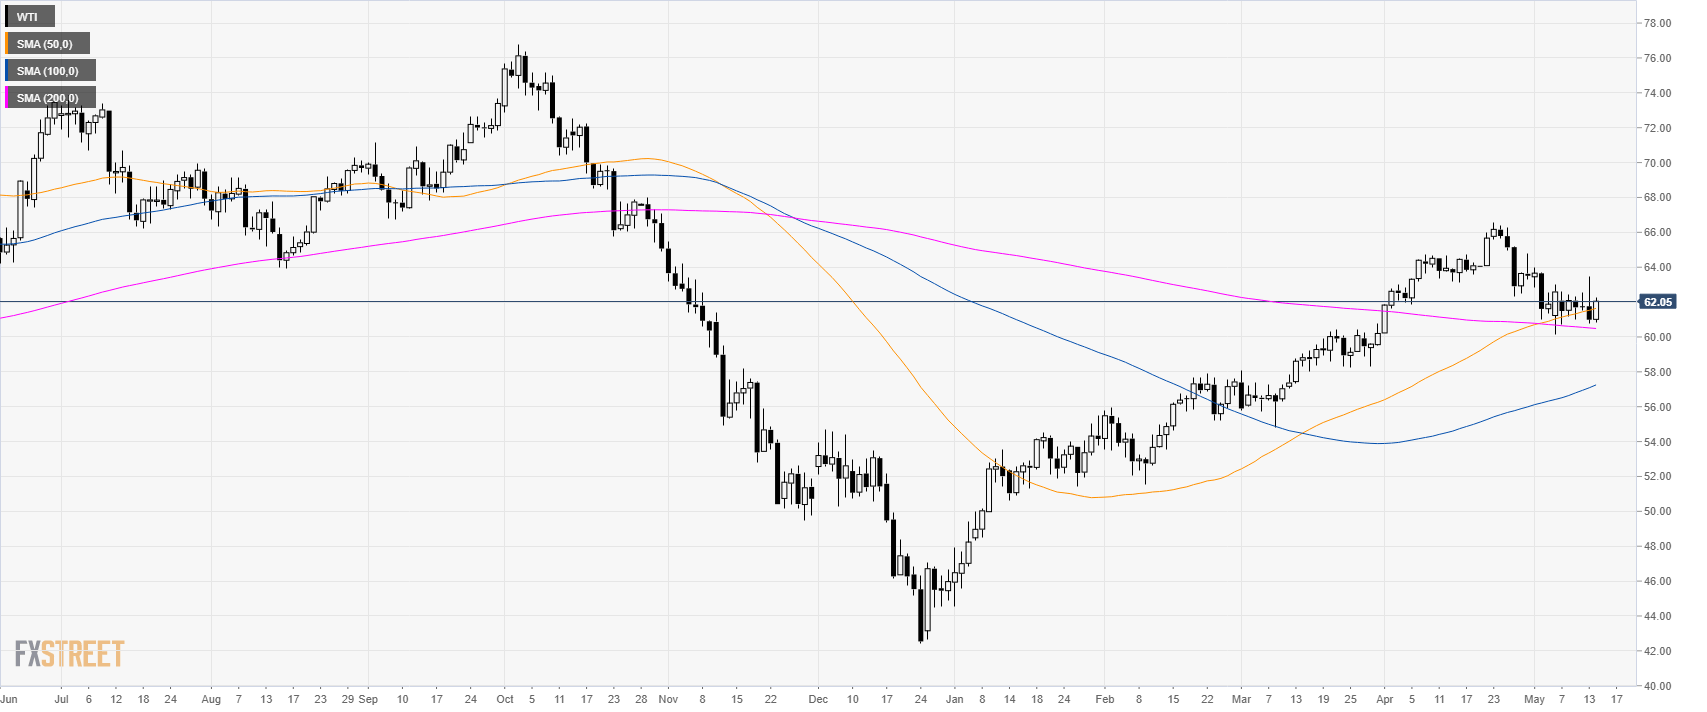
Oil daily chart
WTI (West Texas Intermediate) is in consolidation mode after having peaked just above $66.00 a barrel. In the last seven days, the market has been hovering near 62.00 the figure.
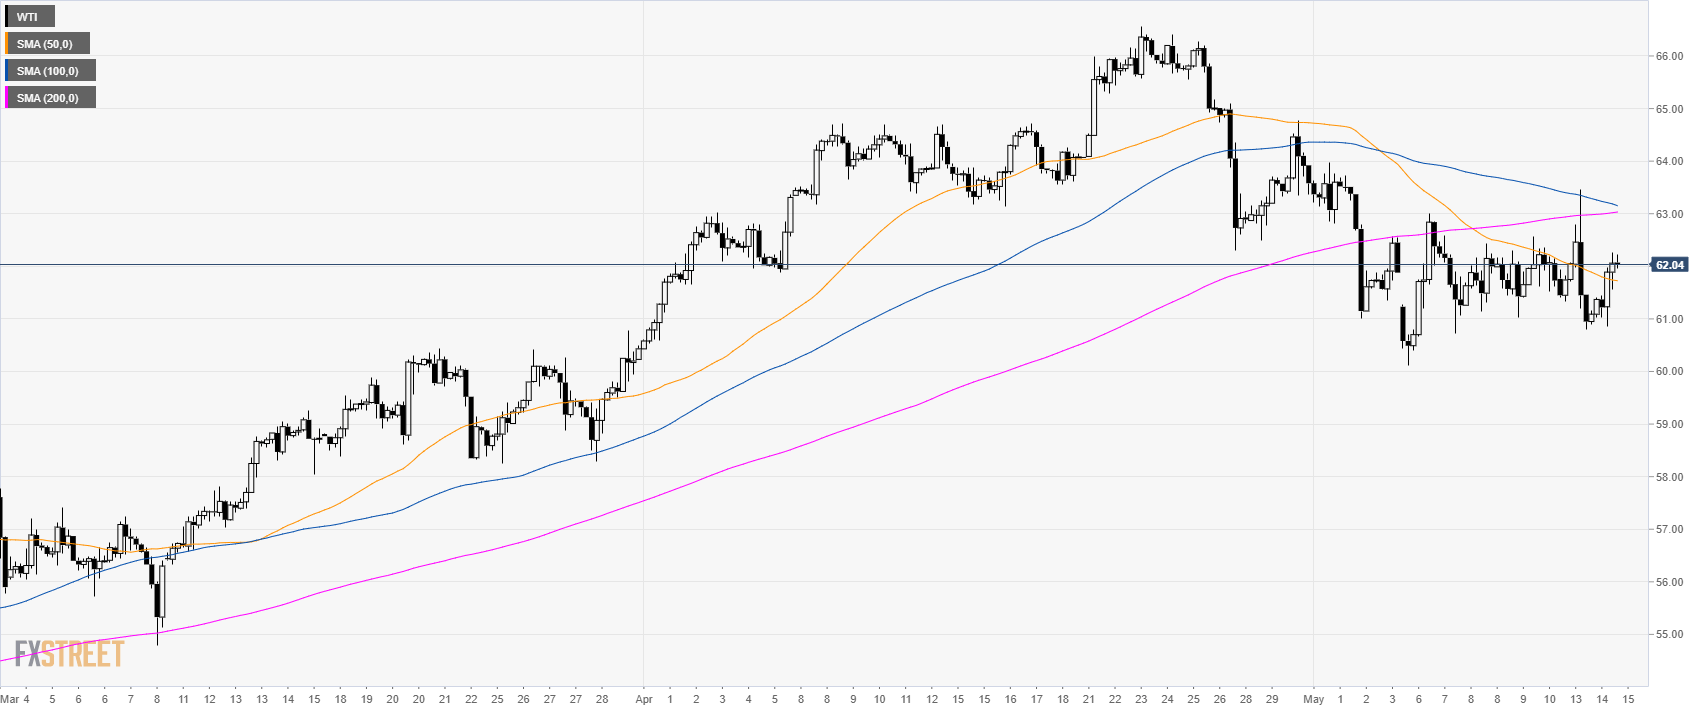
Oil 4-hour chart
On the 4-hour chart, WTI is seesawing below its main SMAs suggesting sideways to bearish pressure in the medium term.
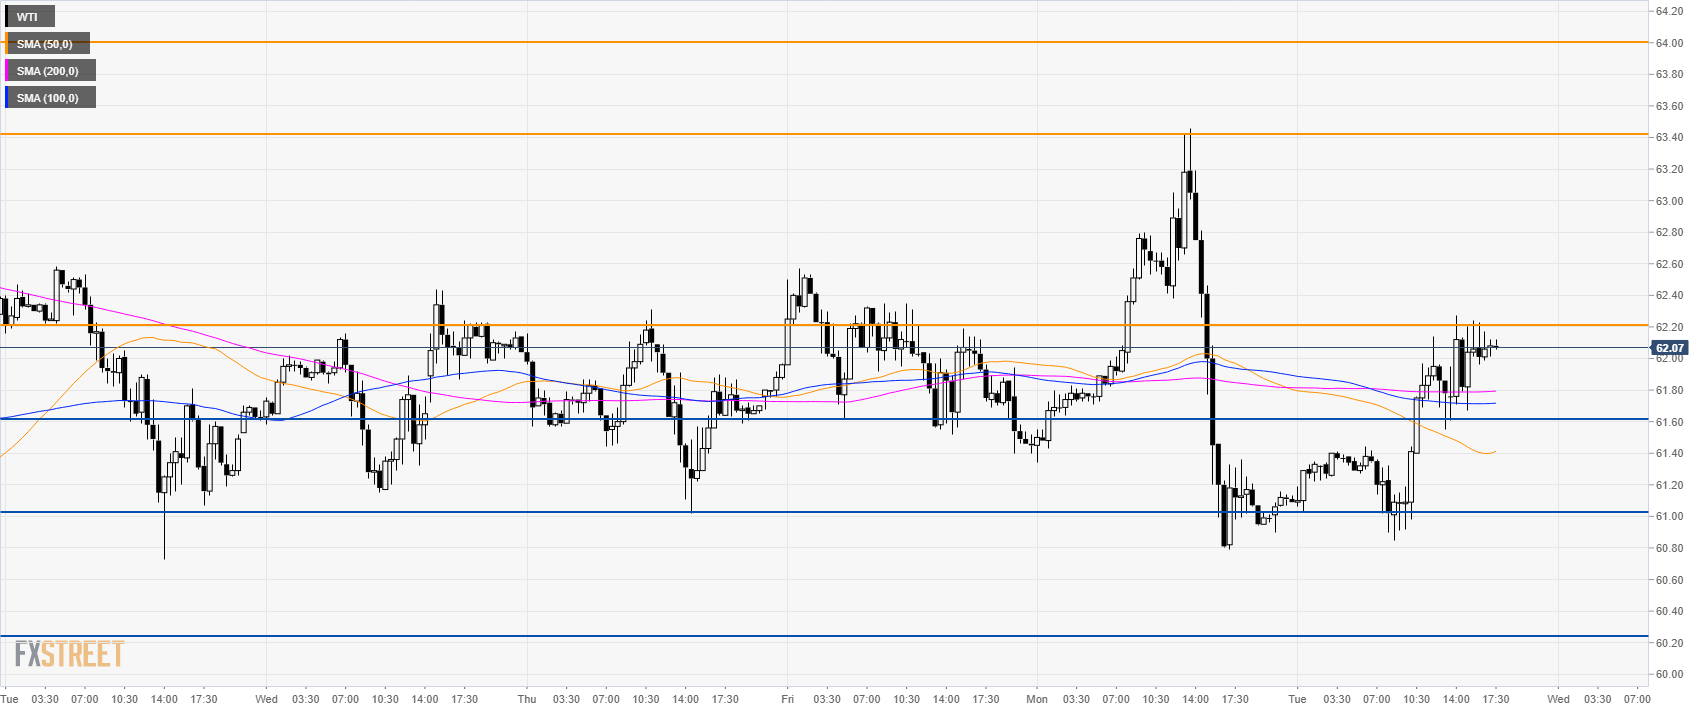
Oil 30-minute chart
The market is ranging. 62.20 was an important level in the last few days and can provide quite a lot of resistance. However, if broken bulls can easily drive the market to 63.40 last swing high.
On the way down, 61.60 and 61.00 figure can provide support. If 61.00 gets broken to the downside, 60.20 can be the next support level to watch.
Additional key levels
