- Symmetrical triangle confines the moves in a 20 pip area.
- Gradually improving RSI favors the upside.
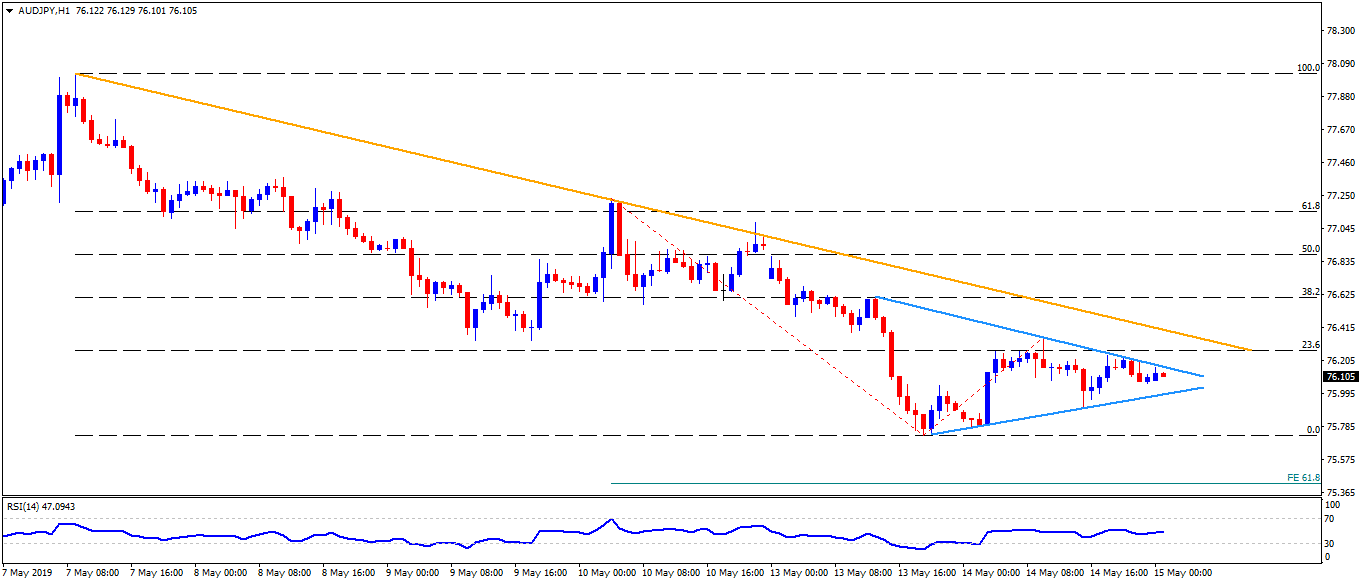
Looking at the AUD/JPY pair’s moves since the week-start, a short-term symmetrical triangle is being portrayed on an hourly chart as the quote ticks near 76.15 during early Wednesday.
While the 76.20 number acts as formation resistance, 76.00 comprises pattern support.
Given the gradual improvement of 14-bar relative strength index (RSI), the pair is more likely to clear 76.20 and head towards confronting a weeklong descending trend-line resistance of 76.45.
Should there be additional upside past-76.45, 76.70, 77.00 and 77.40 can entertain follow-on buyers.
In a case where the quote slips beneath 76.00 support, recent lows surrounding 75.70 may come back on the chart ahead of highlighting 61.8% Fibonacci expansion (FE) level of 75.40 as a quote.
Additionally, January 04 near 75.20 and 75.00 should gain bears attention under 75.40.
AUD/JPY hourly chart
Trend: Sideways
