- Gradual improvement in RSI joins a sustained break of short-term resistance to favor the further upside.
- 100-day SMA grabs the spotlight for now.
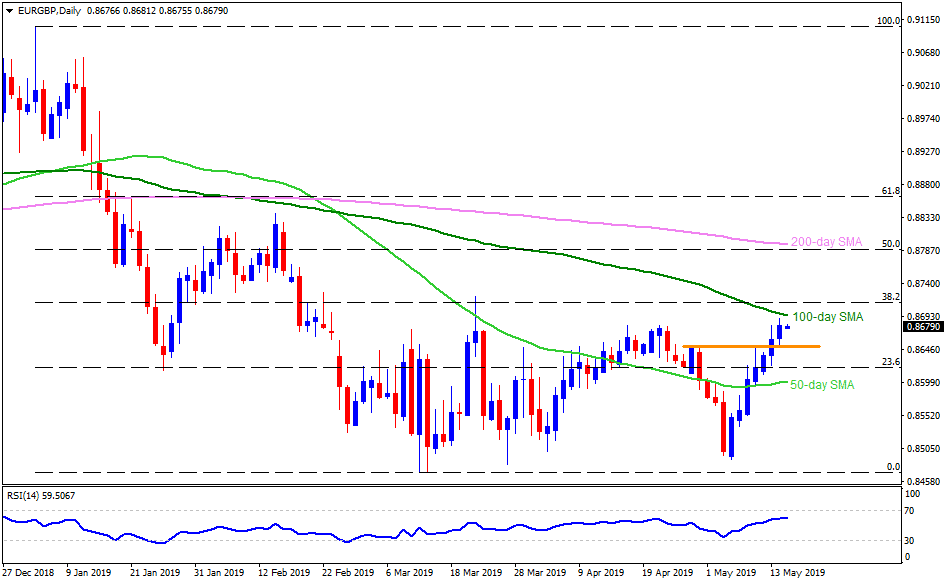
Sustained trading beyond 0.8650/55 horizontal area enables the EUR/GBP pair to trade near 0.8680 while heading into the European session on Wednesday.
Should the bulls remain in command, 100-day simple moving average (SMA) level around 0.8700 can become their immediate favorite prior to the 38.2% Fibonacci retracement of January – March downturn, near 0.8715.
Given the price strength remain intact beyond 0.8715, 0.8740 and 0.8760 can entertain optimism ahead of challenging them with 0.8790 – 0.8800 resistance-zone comprising 200-day SMA and 50% Fibonacci retracement.
It should also be noted that gradual improvement in14-day relative strength index (RSI) speaks loud for the pair’s recent momentum.
Meanwhile, a downside break of 0.8650 is likely a trigger for the quote’s pullback to 23.6% Fibonacci retracement level of 0.8620 whereas 0.8600 comprising 50-day SMA could limit additional declines.
In a case where bears hold the control under 0.8600, 0.8555, 0.8500 and March lows near 0.8470 could be on their radars to target.
EUR/GBP daily chart
Trend: Positive
