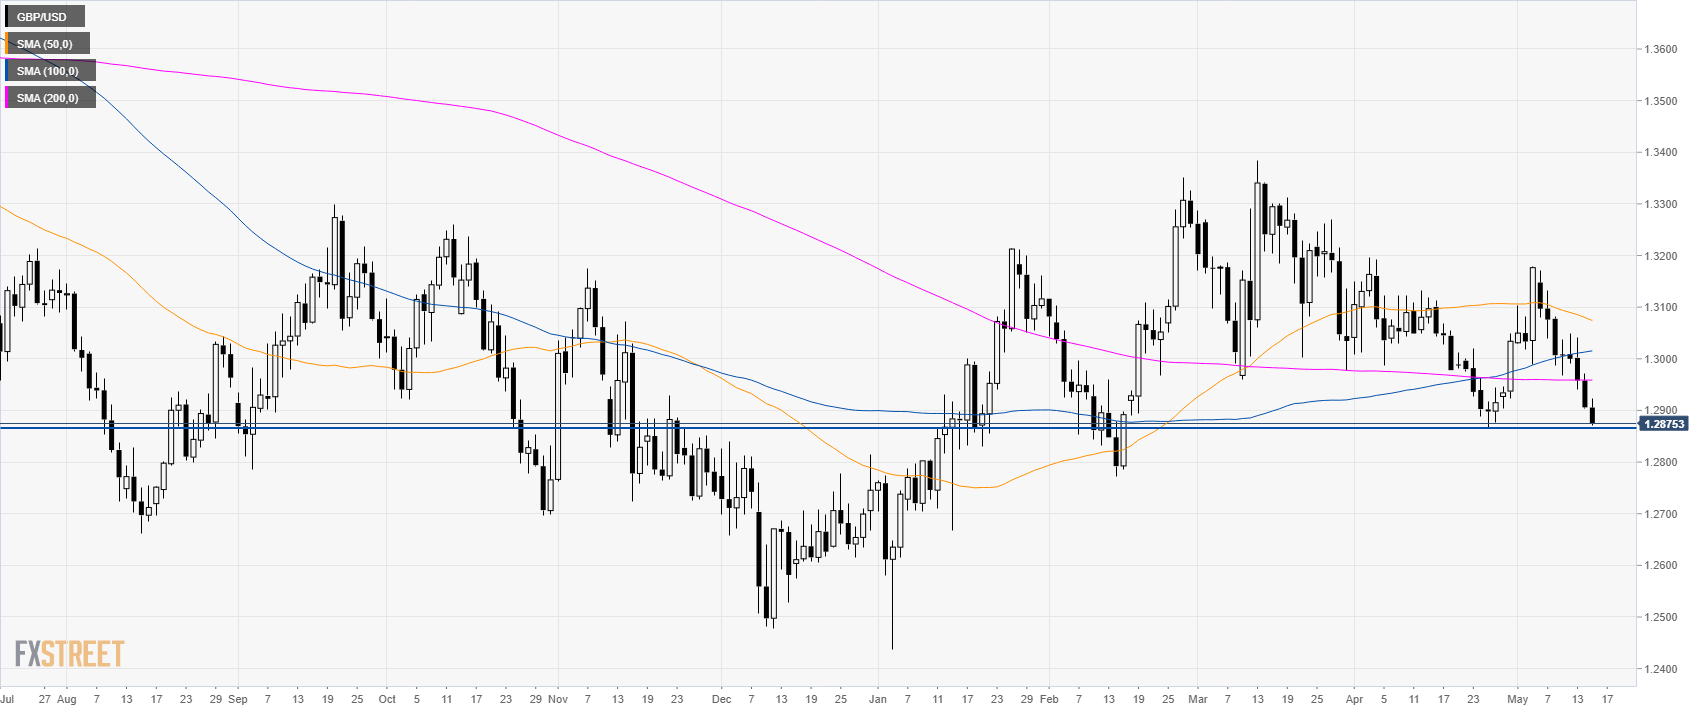
Home GBP/USD technical analysis: Cable in free fall below 1.2900 nearing its lowest point since mid-February
FXStreet News

GBP/USD technical analysis: Cable in free fall below 1.2900 nearing its lowest point since mid-February

GBP/USD daily chart

GBP/USD is trading down sharply below its main simple moving averages (SMAs)  
GBP/USD is nearing 1.2865 April low.


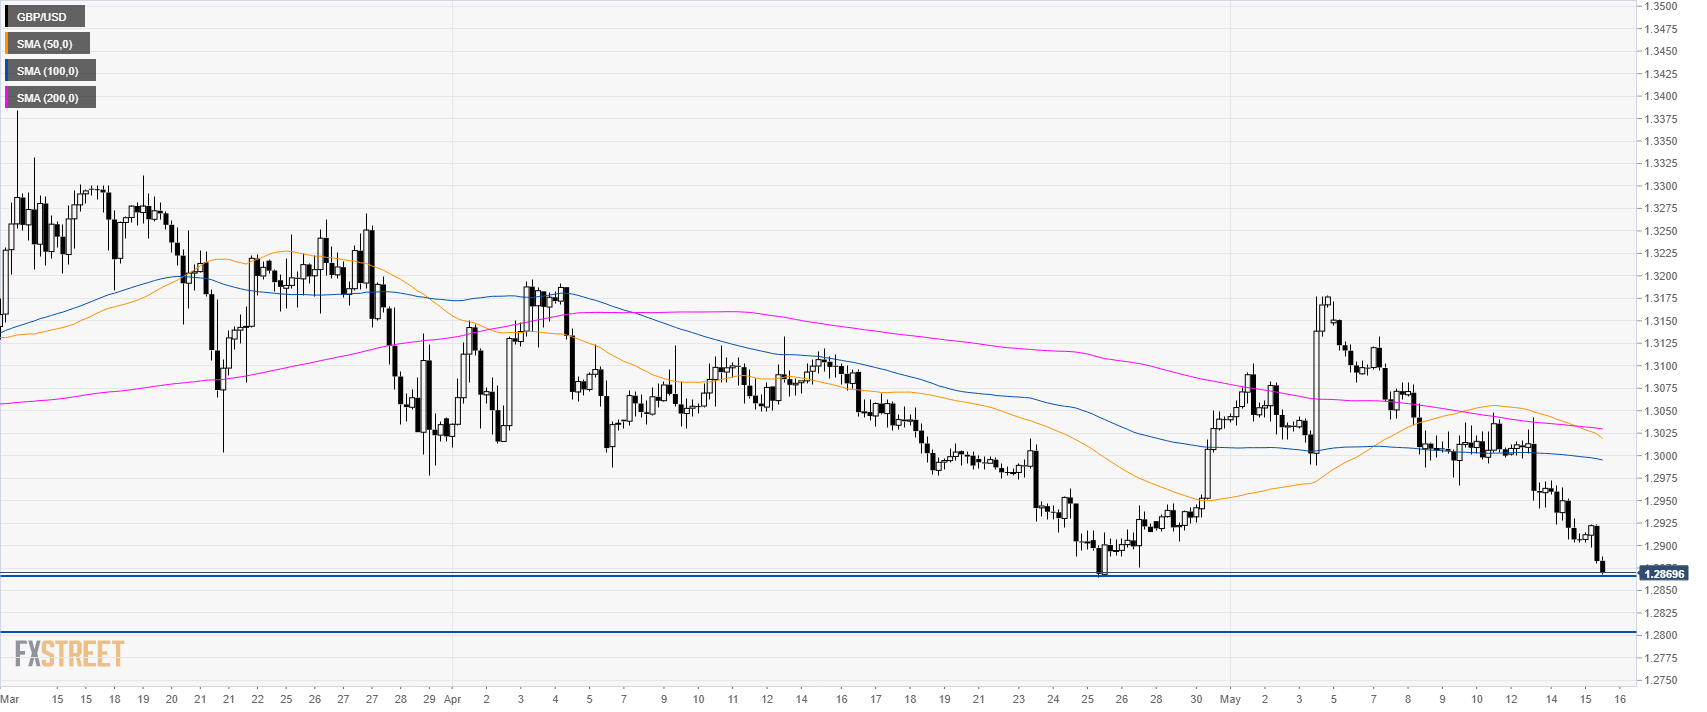
GBP/USD 4-hour chart

GBP/USD is trading below its main SMAs suggesting bearish momentum in the near term. A break below 1.2900 can lead to an extension of the bear move towards 1.2800 figure.

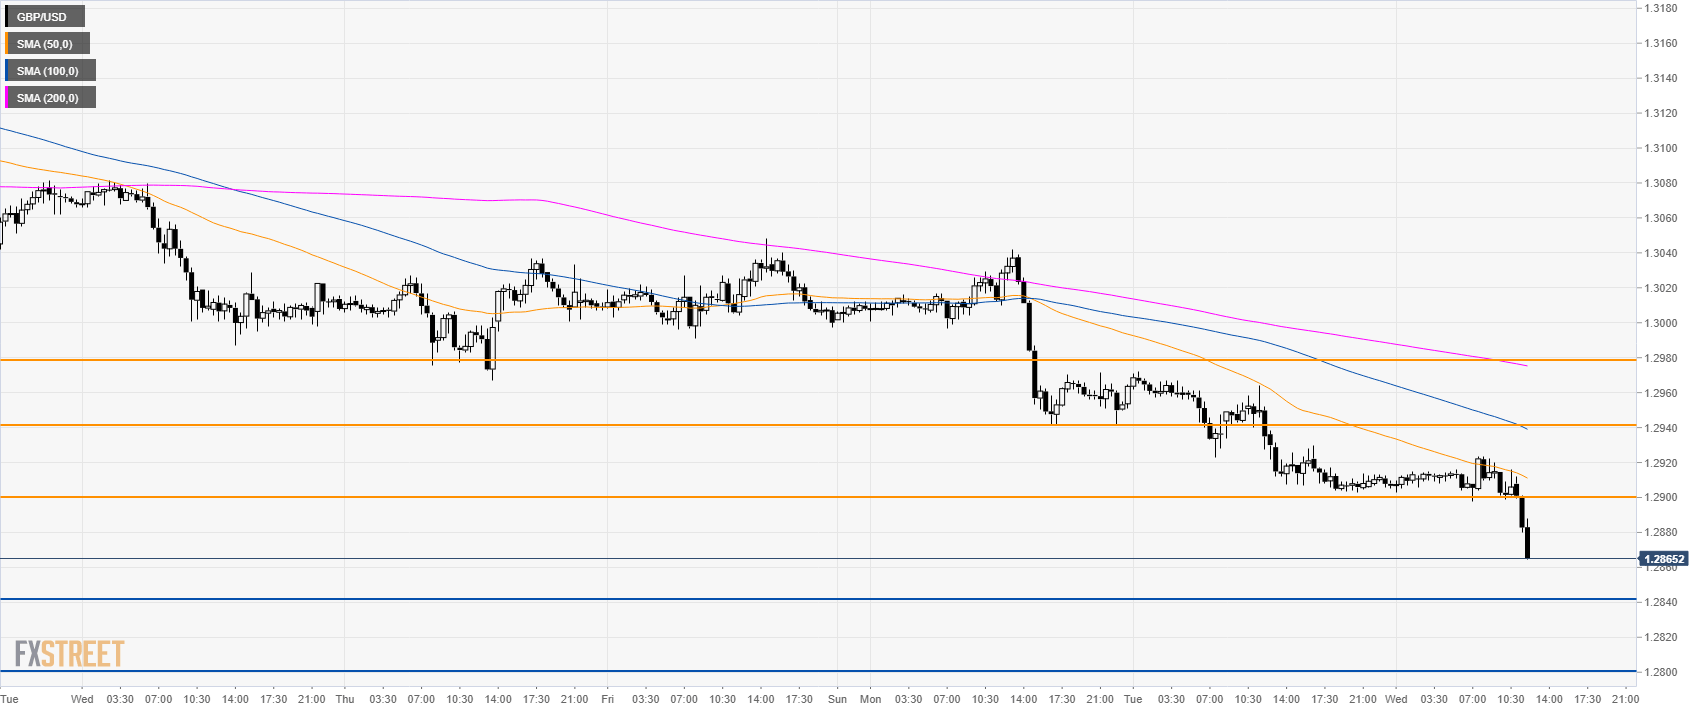
GBP/USD 30-minute chart

The currency pair is trading below its main SMAs as the next support can be located at 1.2840 and 1.2800 figure. Resistance is seen at 1.2900 and 1.2940 price levels.


Additional key levels


FX Street

FX Street

FXStreet is the leading independent portal dedicated to the Foreign Exchange (Forex) market. It was launched in 2000 and the portal has always been proud of their unyielding commitment to provide objective and unbiased information, to enable their users to take better and more confident decisions.