- The rising wedge continues to support sellers despite recent upside.
- The latest pullback from 50% Fibo. might question the bearish formation.
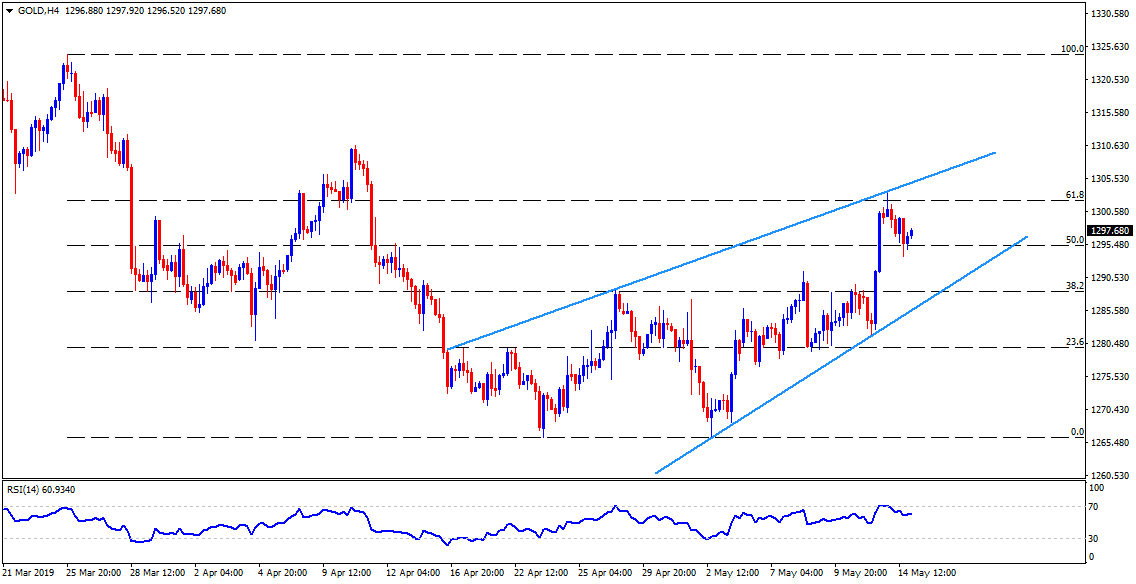
Gold’s U-turn from a four-week-old ascending trend-line highlights “rising wedge” bearish formation on the four-hour chart as the bullion ticks around $1297.30 during early Wednesday.
However, 50% Fibonacci retracement of late-March to the early-May downturn, at $1295.50, triggered the quote’s latest pullback targeting 61.8% Fibonacci retracement level of $1303 and pattern resistance near $1306.
If prices rally past-$1306, the bearish formation gets negated and the buyers can aim for $1311 comprising April month high.
Also, bulls’ dominance past-$1311 enables them to challenge $1313, $1319 and March month high close to $1325.
Meanwhile, $1294 and $1290 can offer nearby supports to the safe-haven whereas break of the $1286, including pattern-support, can confirm additional declines to $1266.50 ¬- $1266 area including latest lows.
However, $1280 and $1273 can offer intermediate halts during the yellow metal’s downside.
Gold 4-Hour chart
Trend: Pullback expected
