- Overbought RSI and 200-day SMA challenge the latest upside.
- Indonesia trade balance data will be in the spotlight for now.
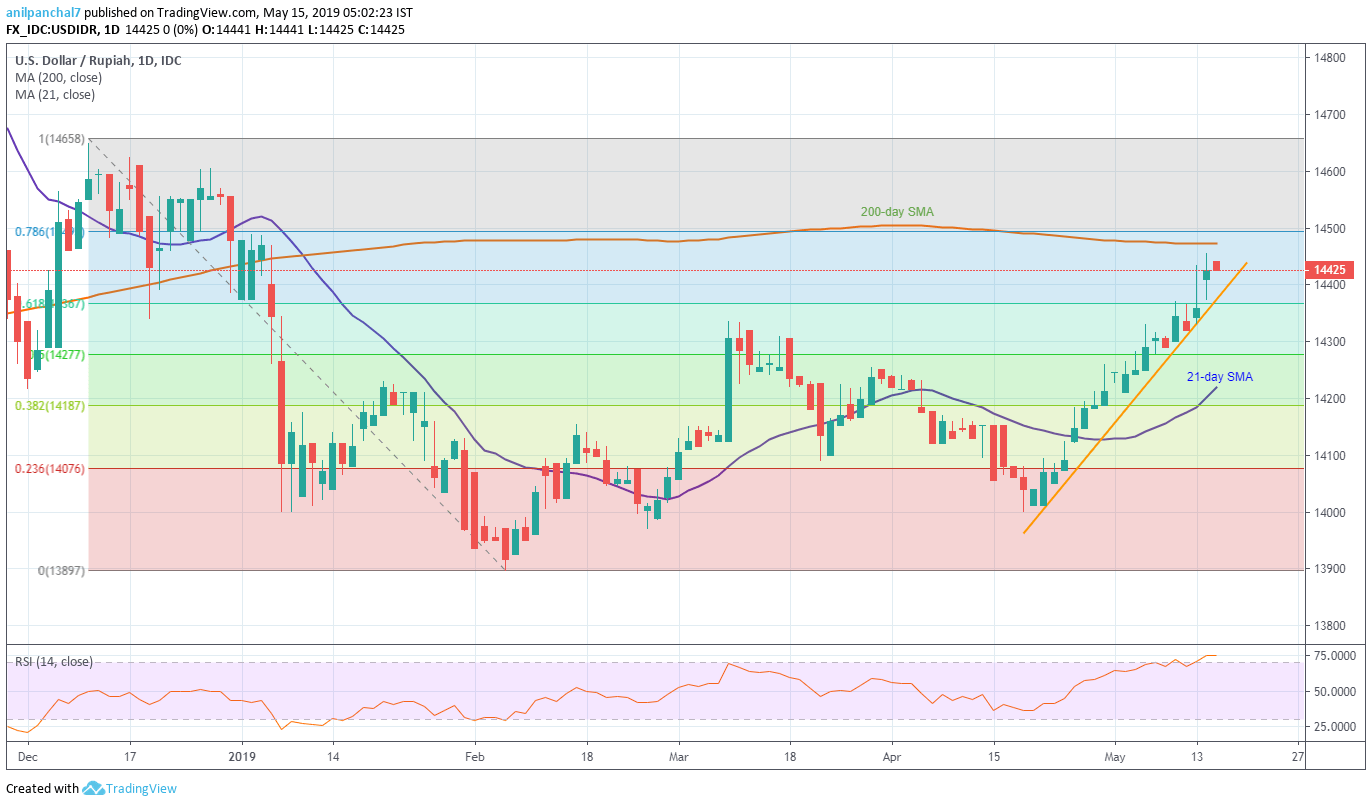
With the overbought RSI levels pulling the pair back from near 200-day SMA, USD/IDR seesaws around 14,425 during the early Asian session on Wednesday.
Traders’ immediate attention will be on April month trade balance data from Indonesia. The trade balance might reverse the previous +$0.54 billion surplus with a deficit figure of -$0.50 billion.
Further, exports are expected to rise from -7.76% to -3.76% whereas exports could also register an increase to -7.15% from -10.01% previous read out.
Given the prices keep declining past-data release, three-week-old ascending trend-line at 14,380 and 61.8% Fibonacci retracement of December 2018 to February 2019 decline near 14,365 can quickly flash on sellers’ radar.
However, pair’s sustained downturn below 14,365 highlights the importance of March month high near 14,335 and 50% Fibonacci retracement level of 14,280 ahead of shifting market attention to 21-day simple moving average (SMA) level of 14,220.
If buyers refrain from respecting overbought levels of 14-day relative strength index (RSI), 200-day SMA level of 14,475 could be of their immediate interest.
Also, successful rise beyond 14,475 can recall 14,485 and 14,610 levels head of pushing bulls toward December highs surrounding 14,650.
USD/IDR daily chart
Trend: Pullback expected
