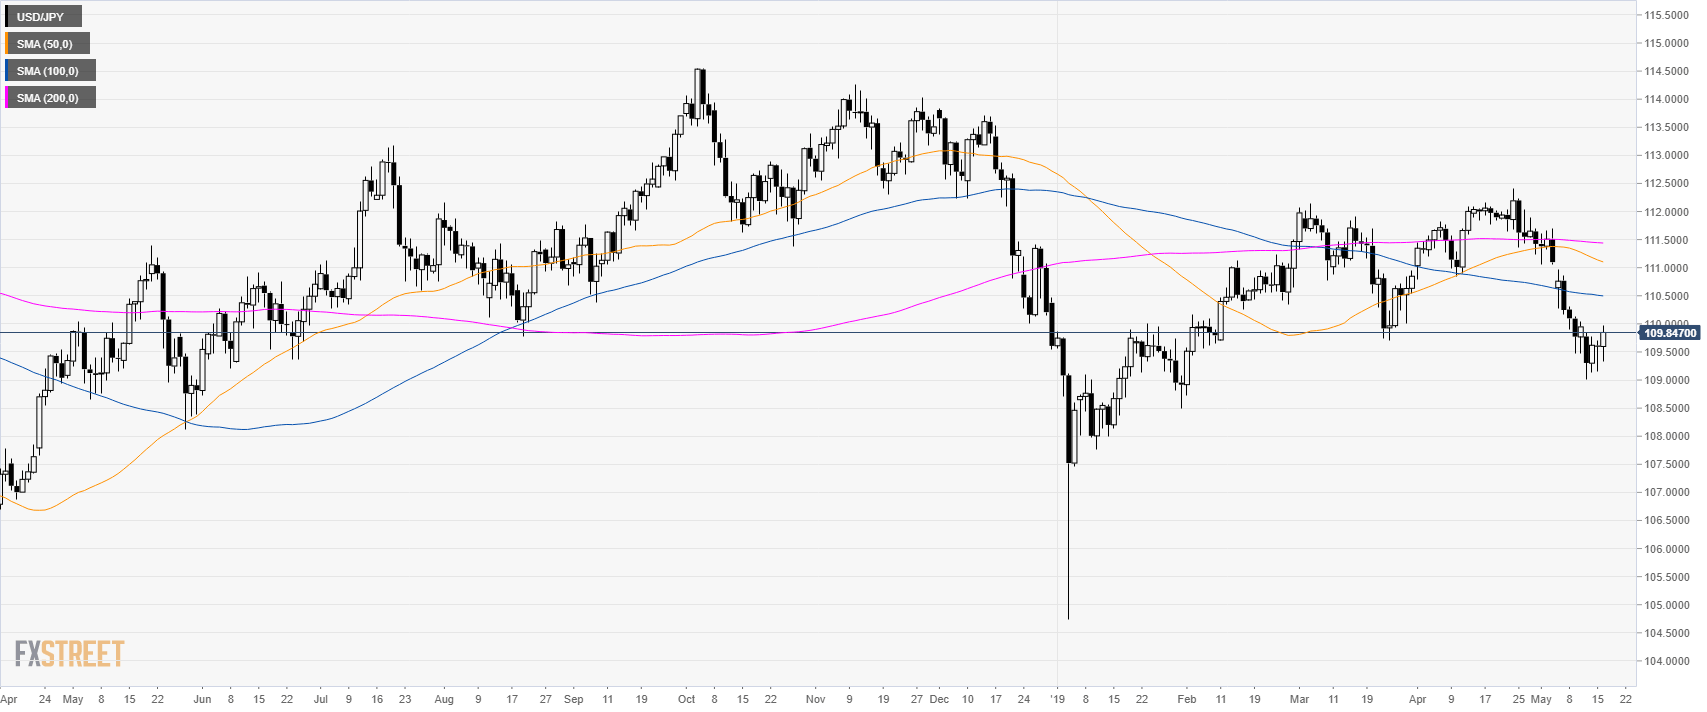
USD/JPY daily chart
USD/JPY is attempting to establish a base above the 109.00 figure.
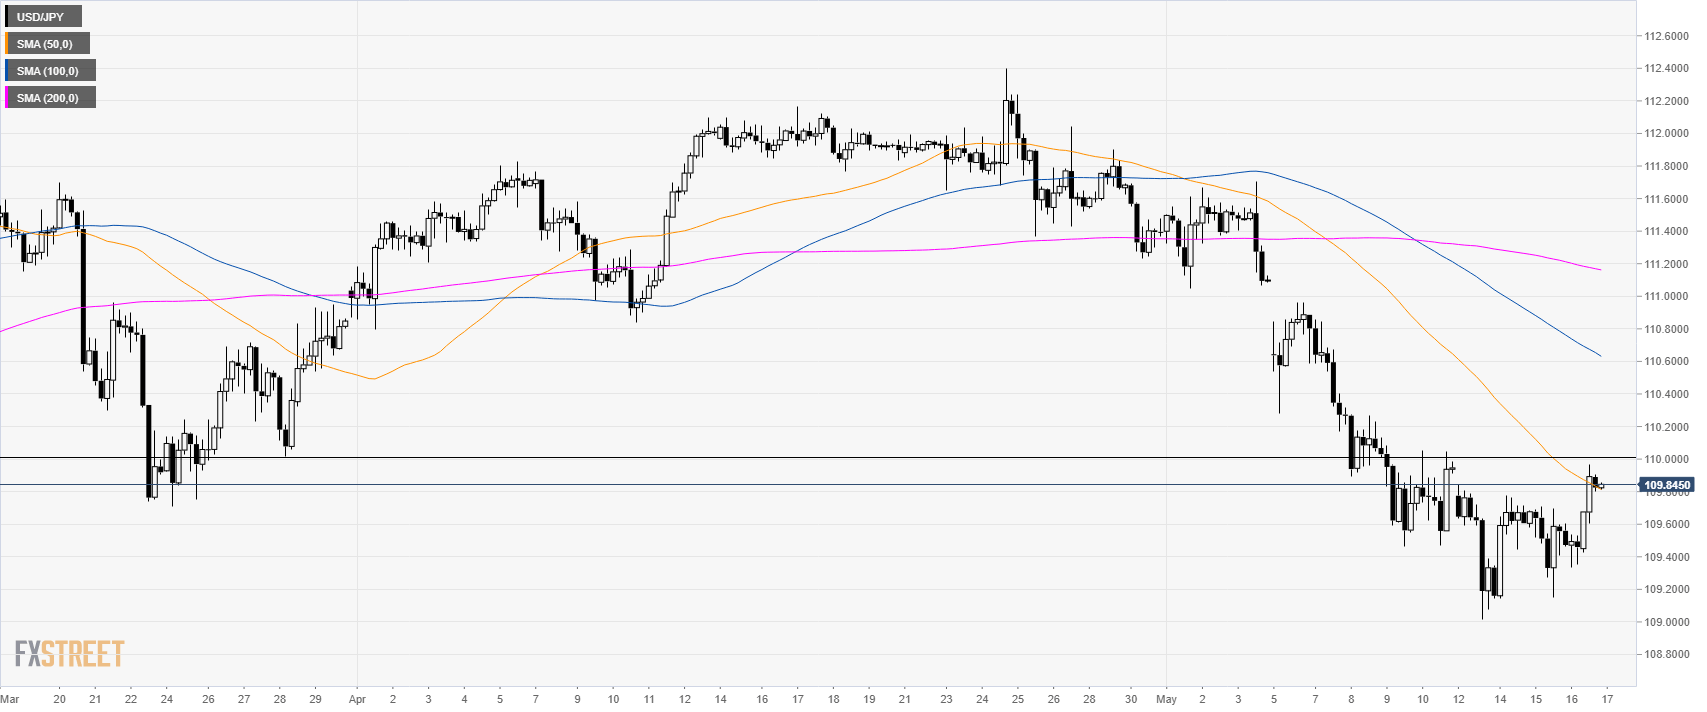
USD/JPY 4-hour chart
USD/JPY is challenging the 110.00 figure and the 50 SMA.
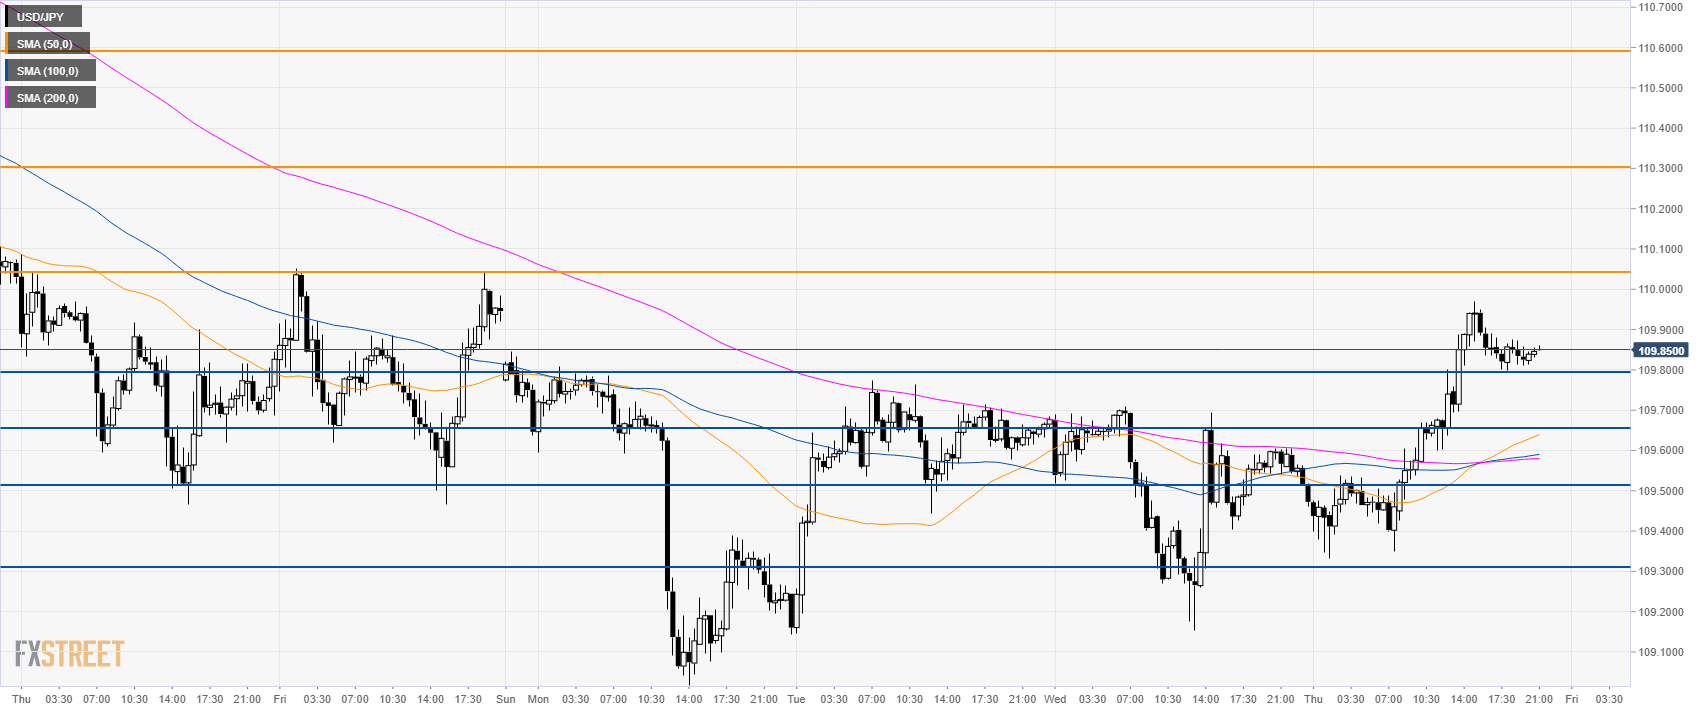
USD/JPY 30-minute chart
USD/JPY is trading above its main SMAs suggesting a bullish bias in the near term.
Bulls need to break above 110.06 strong resistance to move up towards the 110.30 and 110.60 price levels.
Support is at 109.80 and the 109.65 price level. A break below 109.00 on a daily closing basis can invalidate the bullish bias.
Additional key levels
