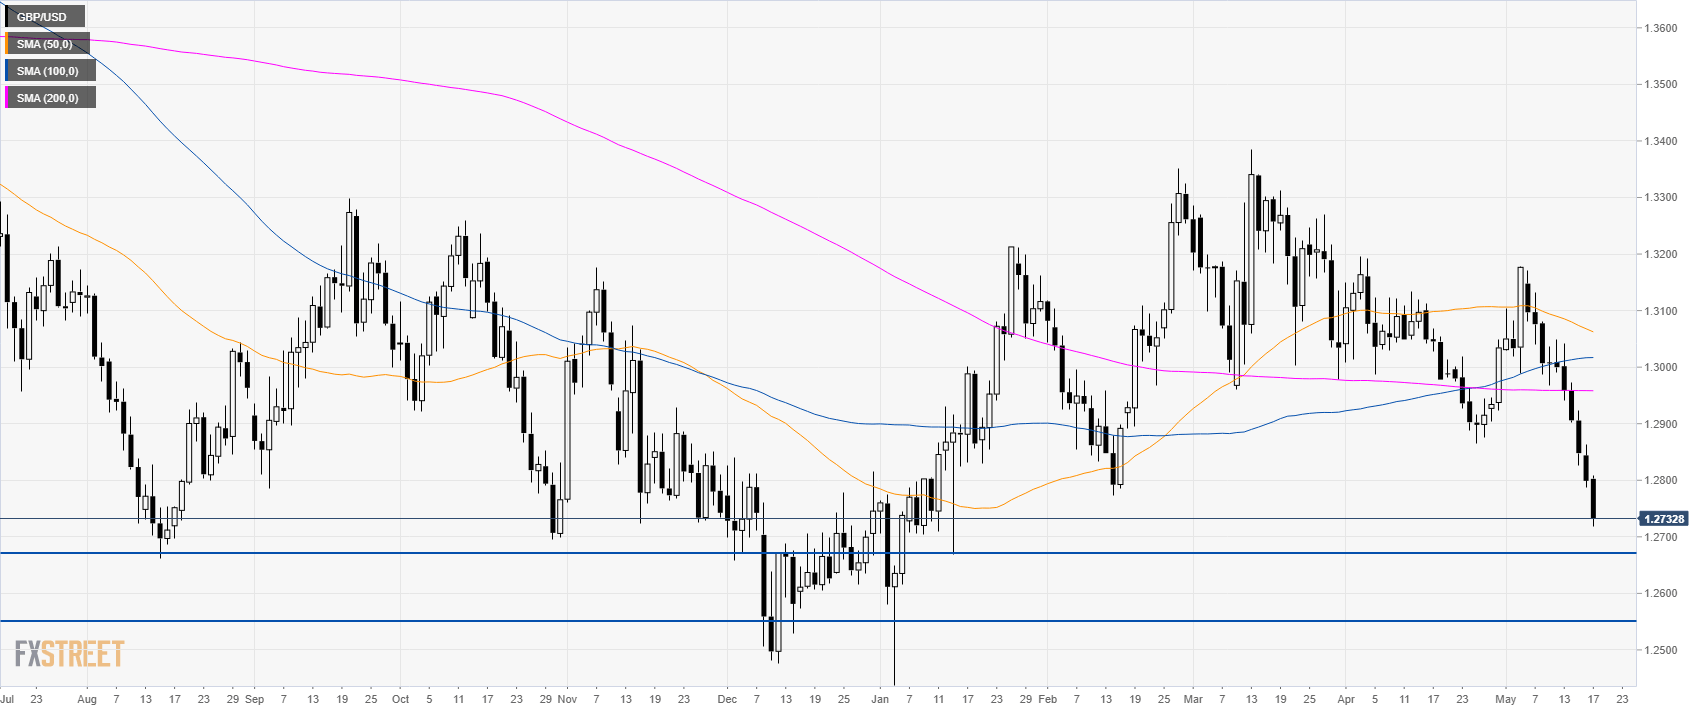
GBP/USD daily chart
GBP/USD is in free fall below its main simple moving averages (SMAs). The market can continue to fall towards, 1.2700 figure, 1.2670 swing low and 1.2550 figure.
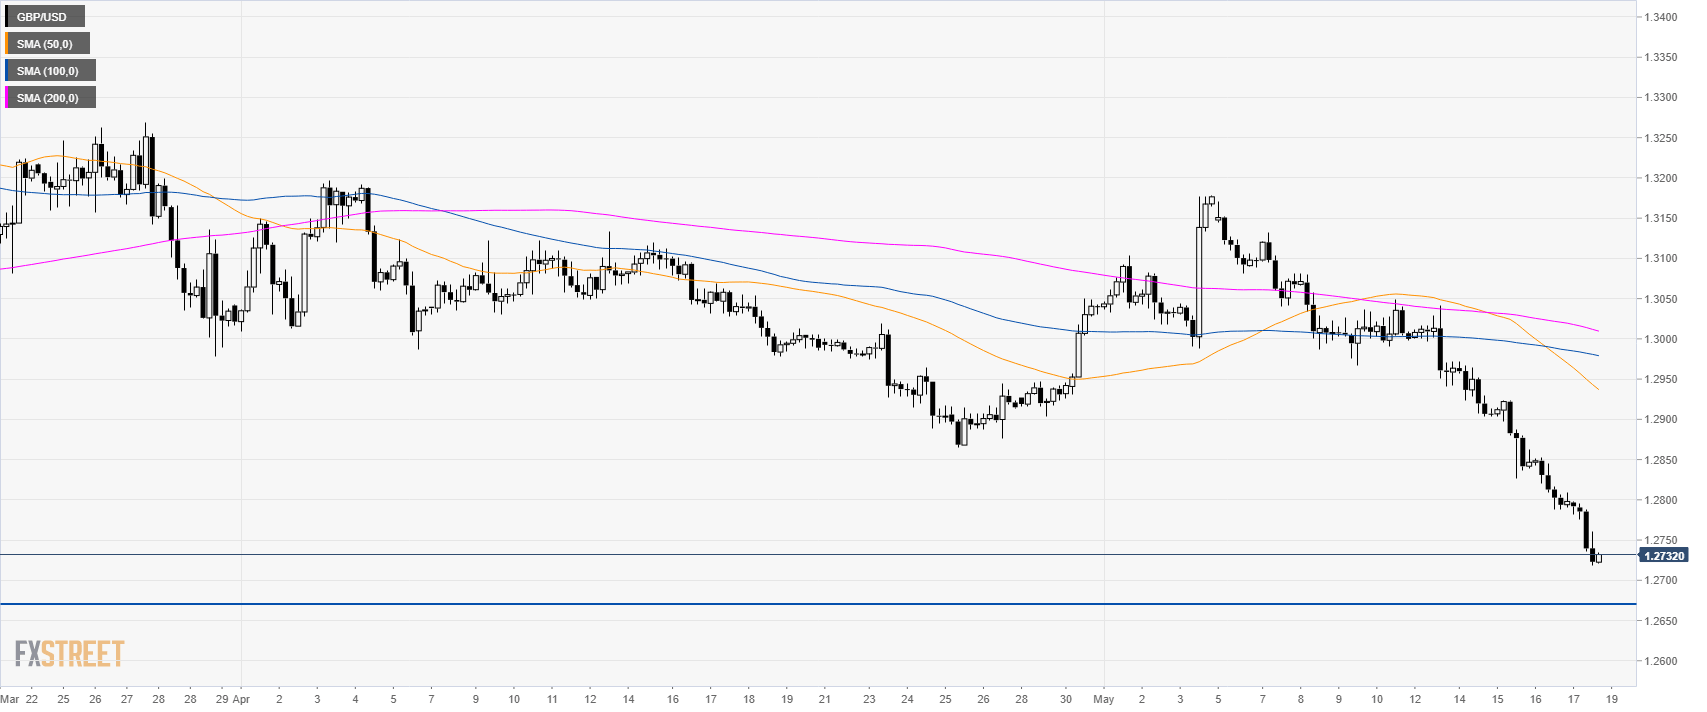
GBP/USD 4-hour chart
GBP/USD is trading steeply down below its main SMAs.
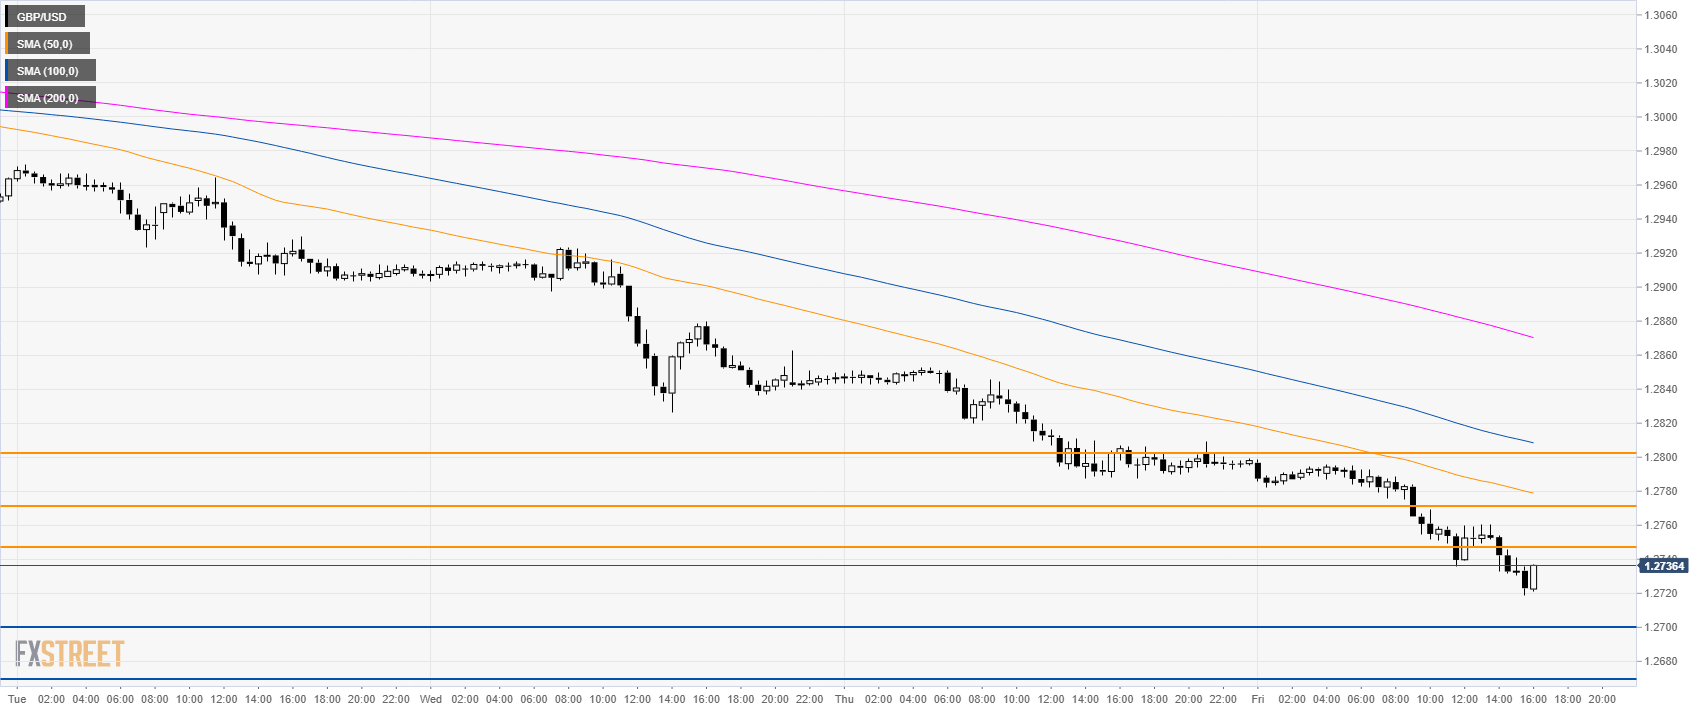
GBP/USD 30-minute chart
Cable is trading below its main SMAs as the market is breaking support levels one after another. To the downside, 1.2700 and 1.2670 can be next while 1.2750/70 and 1.2800 are seen as resistances.
Additional key levels
