- Break of 61.8% Fibonacci retracement highlights 1.2770 support.
- Oversold RSI could trigger pullback towards 1.2865.
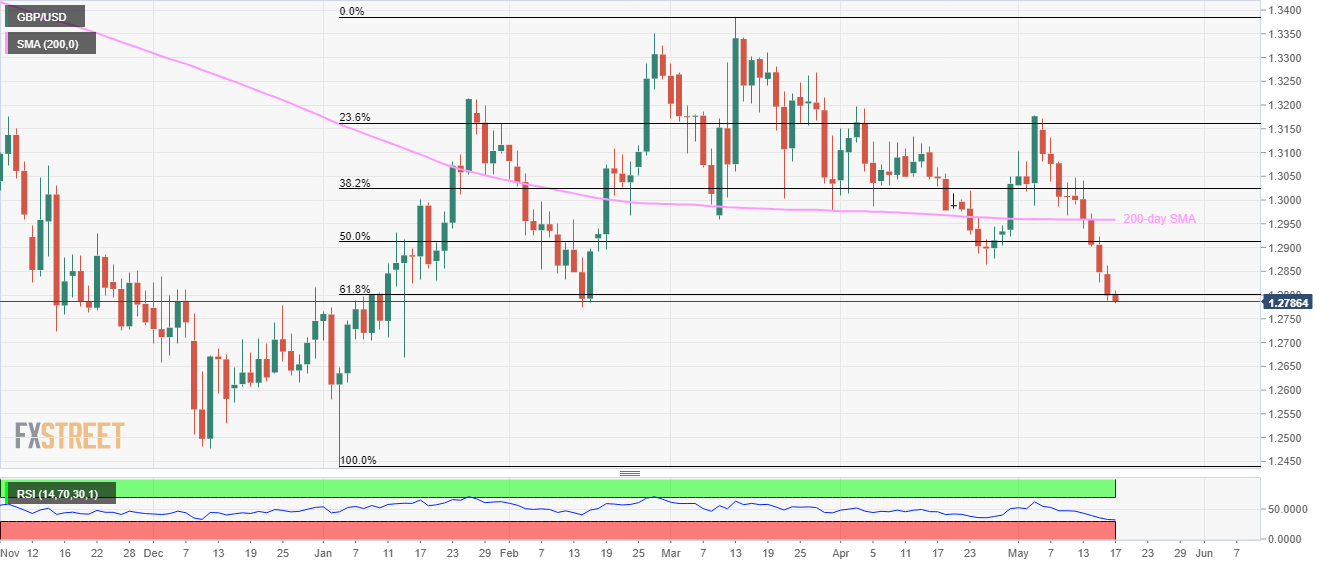
Having slipped under 61.8% Fibonacci retracement of March month upside, GBP/USD presently trades near 1.2790 ahead of the London markets open on Friday.
Considering the pair’s slip under important support, the current south-run should extend. However, oversold levels of 14-day relative strength index (RSI) challenges the bears at the moment.
As a result, chances of its pullback to 1.2865 and then to 50% Fibonacci retracement level of 1.2915 seem brighter.
Given the quote’s additional rise beyond 1.2915, 200-day simple moving average (SMA) level of 1.2960 may limit further upside.
Alternatively, February month low around 1.2770 may act as immediate support during further declines, a break of which can fetch prices to 1.2710 and then to January 15 bottom of 1.2670.
Should sellers keep dominating price sentiment under 1.2670, 1.2610, 1.2530 and 1.2480 could be on their radars.
GBP/USD daily chart
Trend: Pullback expected
