“¢ Gold stalled this week’s corrective slide from near one-month tops, levels just above the key $1300 psychological mark, and managed to find some support near a previous trend-line resistance break-point.
“¢ The mentioned support coincides with 50% Fibonacci retracement level of the commodity’s recent up-move from $1266 to $1303 and might now act as a key pivotal point for the next leg of a directional move.
Meanwhile, the overnight slide dragged the precious metal below an important confluence support – comprising of an ascending trend-line extending from monthly swing lows, 200-hour SMA and 38.2% Fibo. level, which might now keep a lid on any attempted positive move.
Technical indicators on hourly charts maintained their bearish bias and support prospects for a further near-term depreciating move. However, oscillators on the daily chart are holding in the neutral territory, holding traders from placing any aggressive bearish bets.
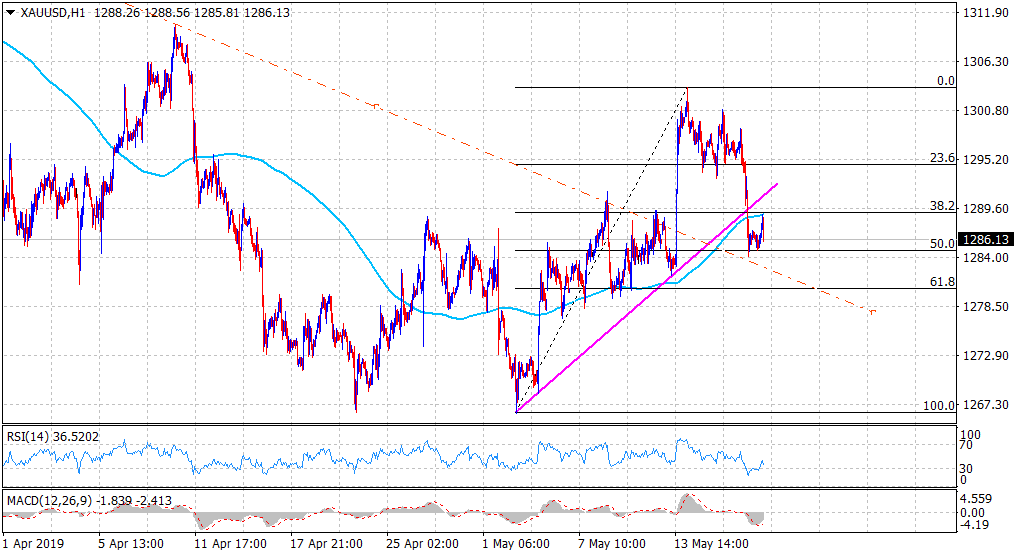
Hence, it would be prudent to wait for a strong follow-through selling below 50% Fibo. level support near the $1285 region before positioning for a slide towards 61.8% Fibo. level, around the $1280 level, en-route the $1277 area – last week’s swing low.
Gold 1-hourly chart