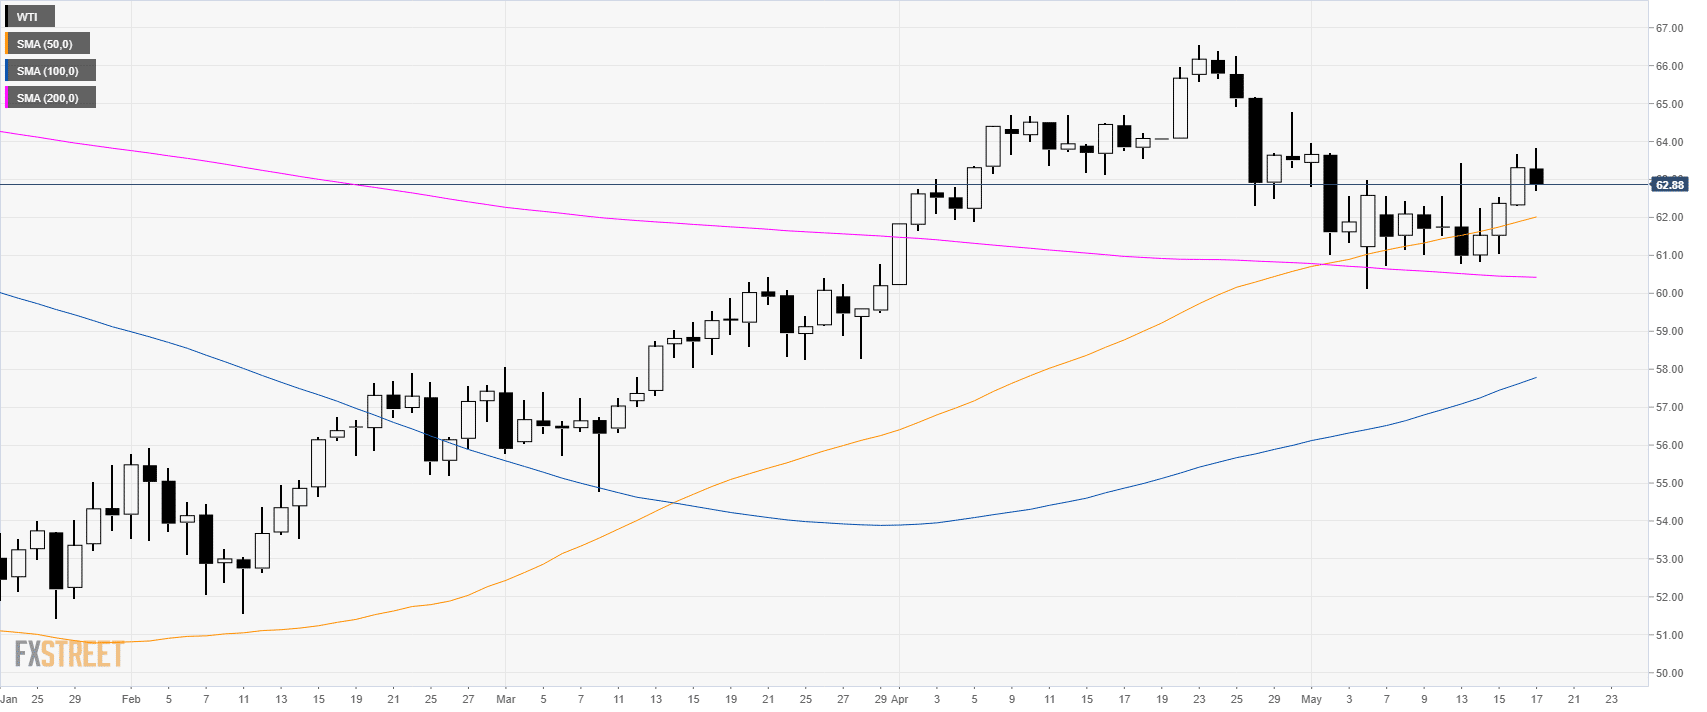
Oil daily chart
WTI (West Texas Intermediate) is in consolidation mode below $64.00 a barrel.
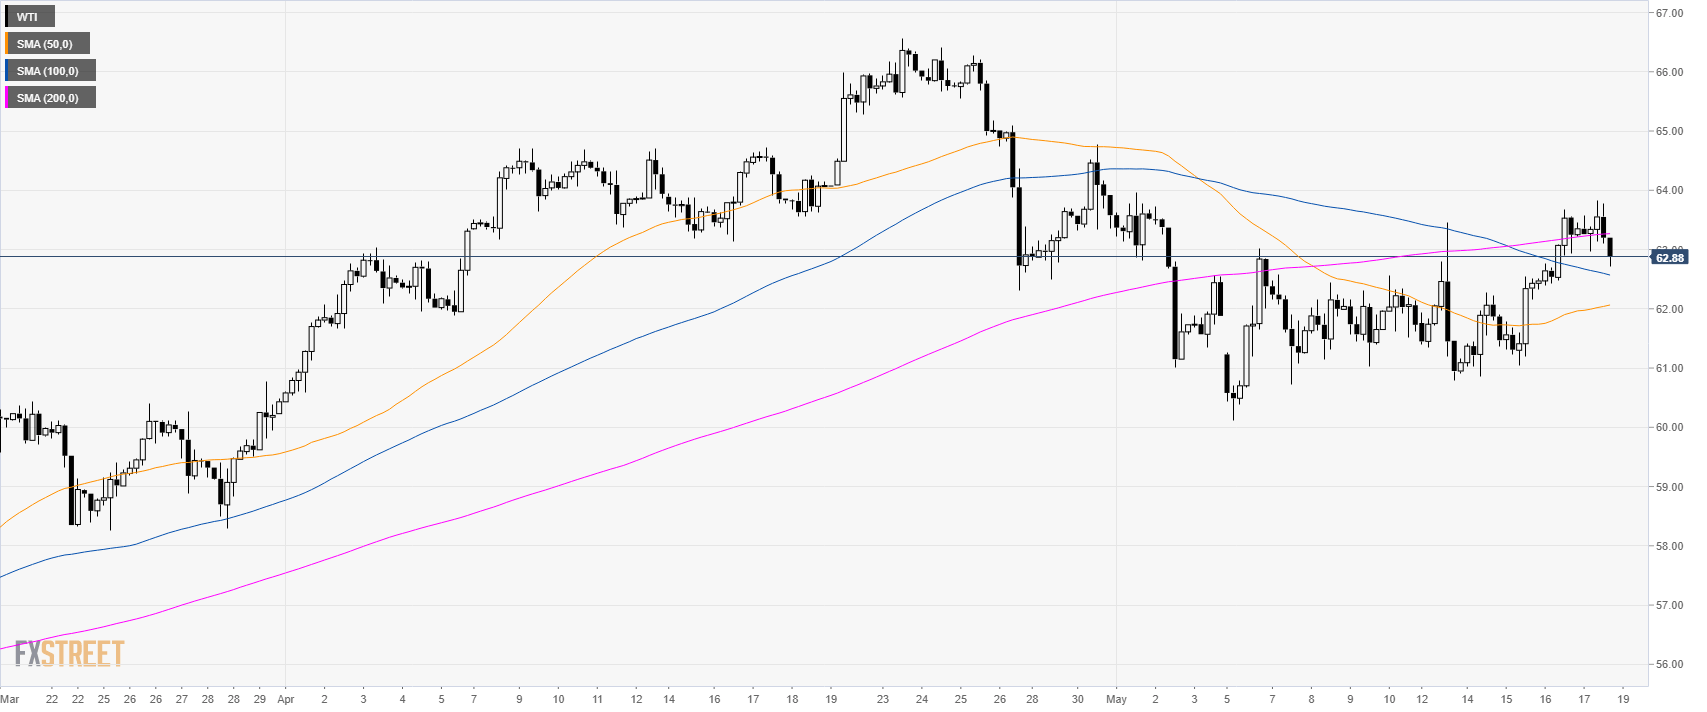
Oil 4-hour chart
On the 4-hour chart, WTI is trading between the 200 and the 100 simple moving averages (SMAs) suggesting a potential correction down in the near term.
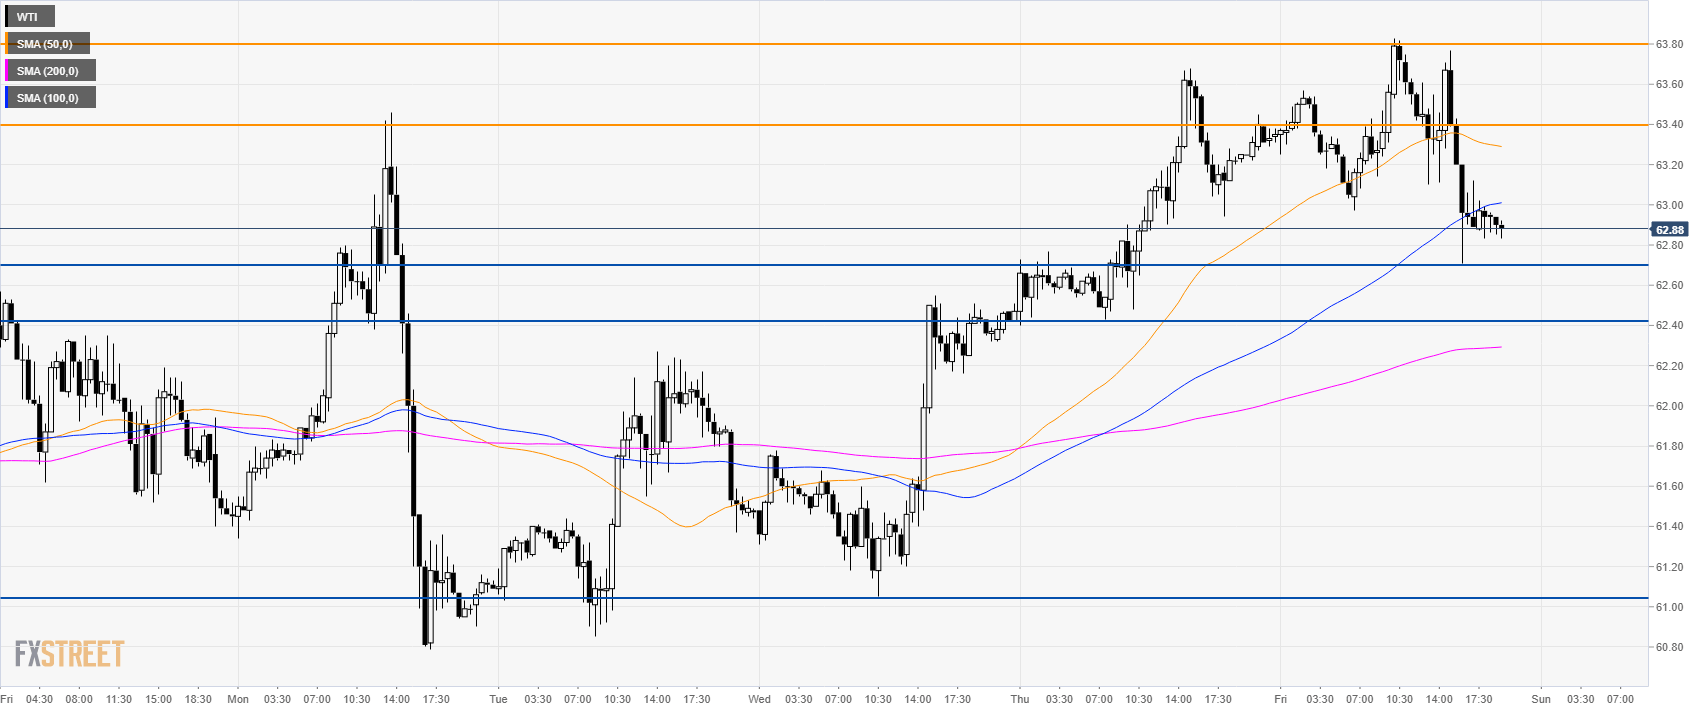
Oil 30-minute chart
WTI is trading below the 63.00 figure and the 50/100 SMAs suggesting further down move. Bears will need to overcome 62.70 and 62.50 support to travel to 61.05 support. Resistances are seen at 63.40 and 63.80 levels. A bullish break above 64.00 might invalidate the bearish bias.
Additional key levels
