- 200-day SMA challenges the upside based on near-term support-line.
- Multiple Fibonacci retracements and a horizontal resistance might also keep prices in check.
Although a month old ascending trend-line portrays the USD/IDR pair’s strength, 200-day SMA limits the immediate upside at the quote trades near 14,450 on early Friday.
Considering the pair’s repeated failures to clear 200-day simple moving average (SMA) on a closing basis, chances of witnessing a pullback to 14,380 support-line seem brighter.
Should there be additional declines under 14,380, 14,350/40 and 14,230 are likely following numbers to appear on the chart.
In a case where prices rally beyond 200-day SMA level of 14,480, 50% Fibonacci retracement of its September 2018 to February 2019 downturn at 14,650 can please buyers ahead of challenging them with 14,720/25 resistance-area including highs marked on December 26 and April 25.
If at all the bulls keep dominating past-14,725 resistance, 61.8% Fibonacci retracement near 14,830 and mid-November highs near 14,935 could please them.
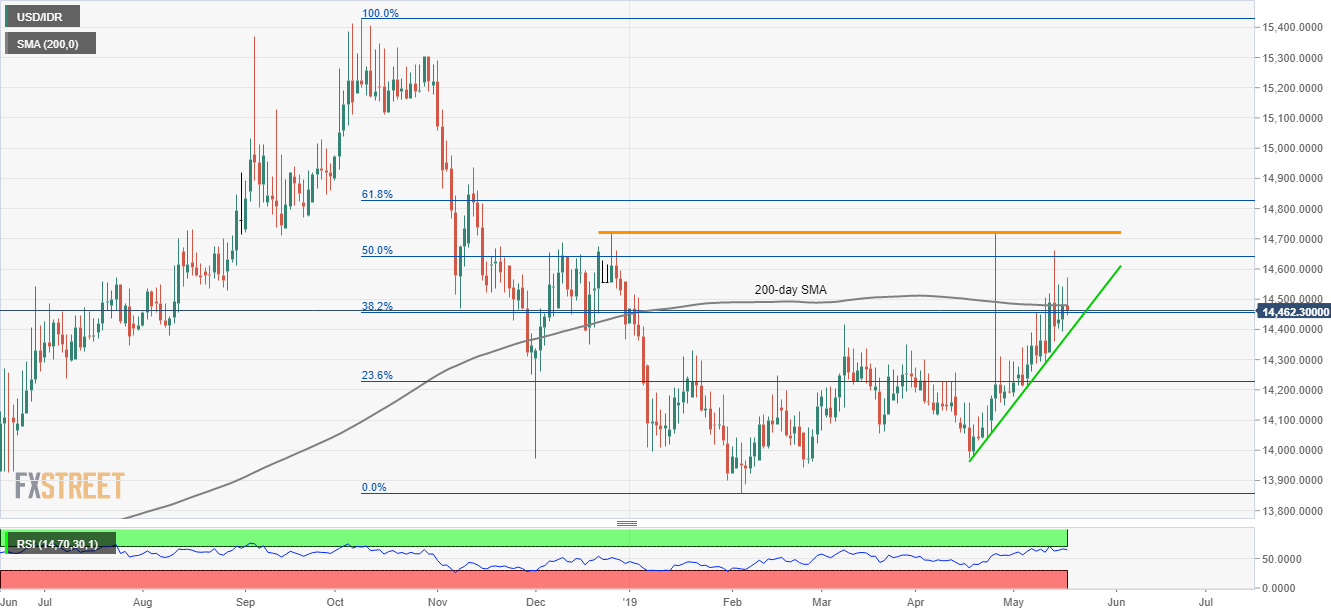
USD/IDR daily chart
Trend: Pullback expected
