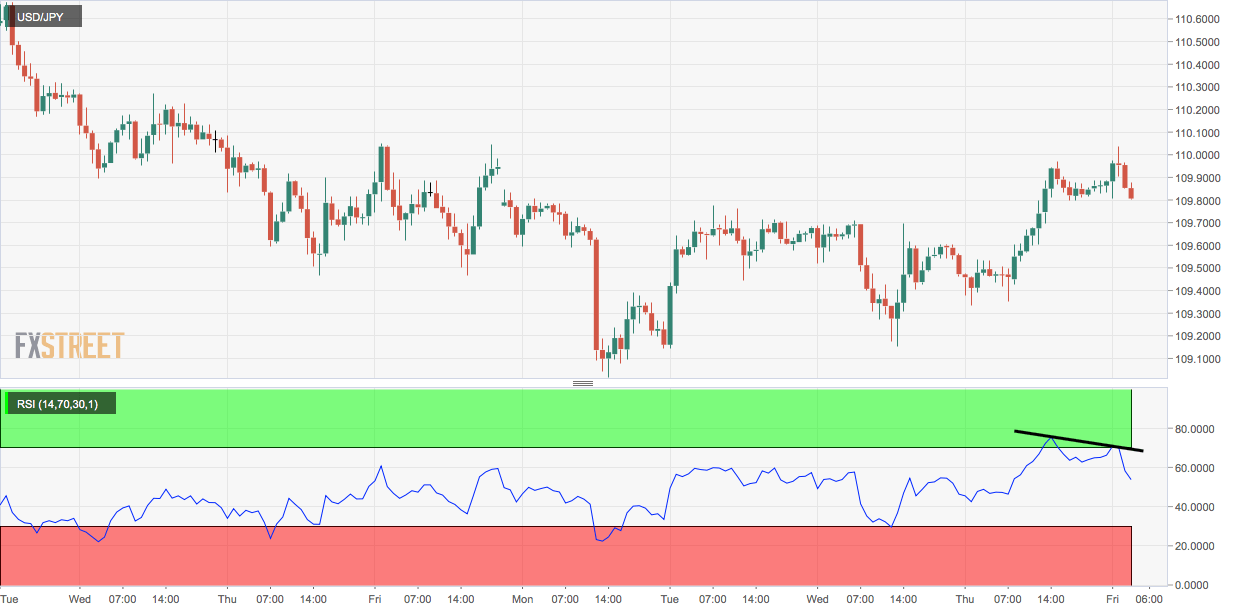
- USD/JPY’s failure to cut through 110.00 resistance has confirmed a bearish pattern on the hourly chart.
- The pair risks falling to the 5-day moving average support in the next few hours.
USD/JPY jumped to 110.00 earlier today, as expected, but failed to chew through offers placed above the psychological resistance and is now trading at 109.85.
With the pullback from the session high of 110.03, the pair has confirmed a bearish divergence (lower highs) on the hourly chart relative strength index (RSI).
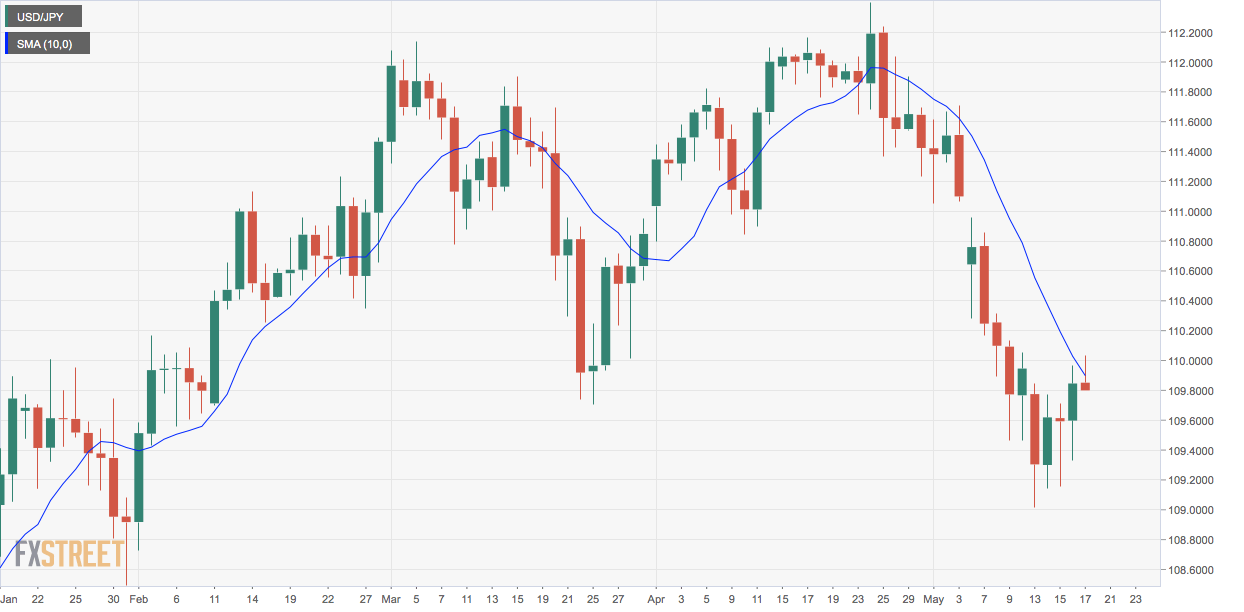
Further, the drop from the 110.03 to 109.84 also marks a failure to hold onto gains above the downward sloping (bearish) 10-day moving average at 109.90.
As a result, the spot could fall further toward the 5-day moving average support, currently at 109.64.
A daily close above 110 is needed to invalidate the short-term bearish setup.
Hourly chart
Daily chart
Trend: Bearish
Pivot points
