- The EIA (Energy Information Administration) Crude Oil Stocks Change to May 17 showed a huge 4.74 M build vs. -0.599M forecast by analysts, sending the black gold sharply down.
- Crude oil is nearing $61.00 a barrel at the time of writing.
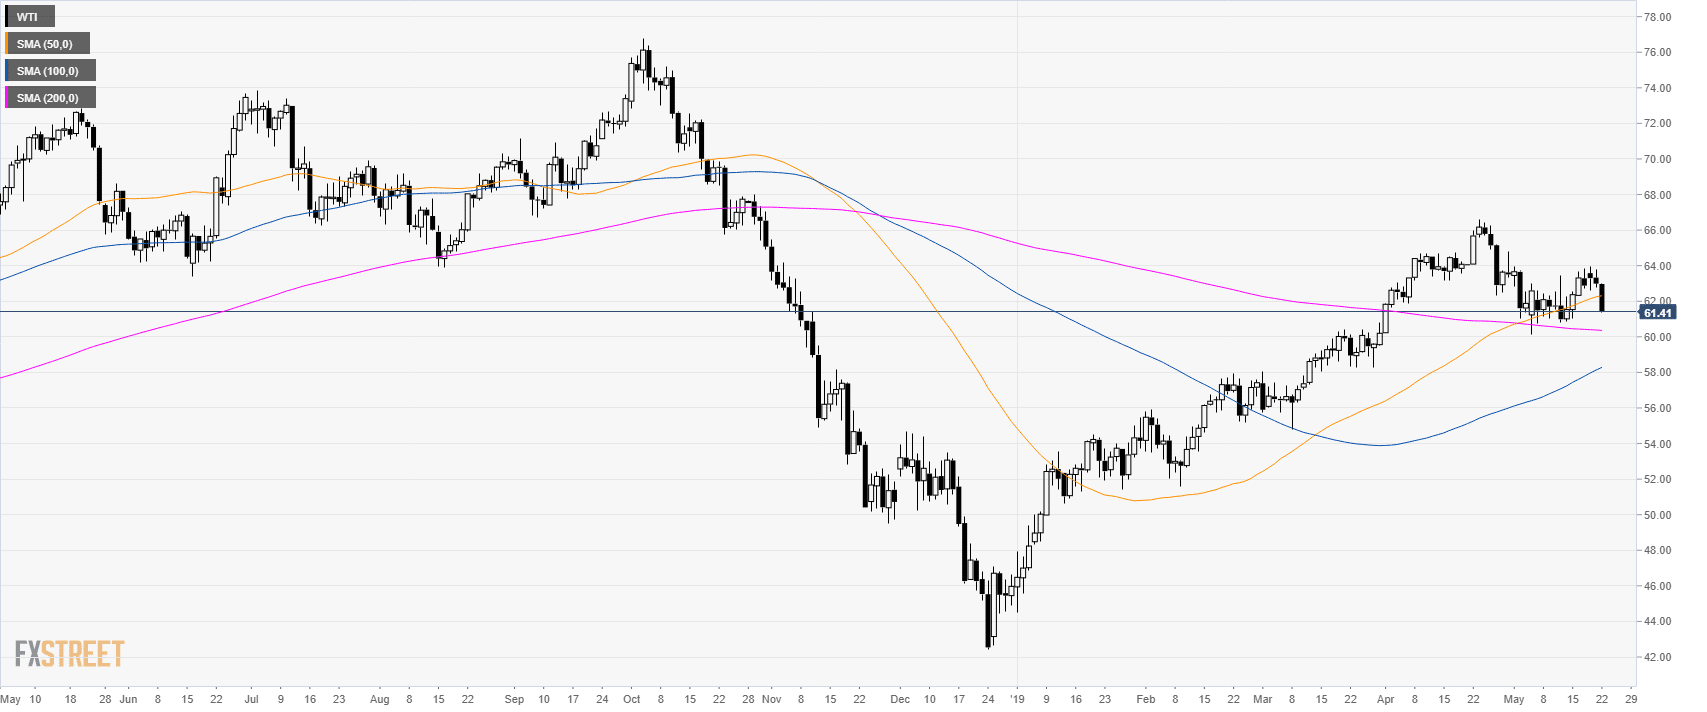
Oil daily chart
On the daily chart, WTI (West Texas Intermediate) is trading in a bull trend above its 100 and 200 simple moving averages (SMAs)
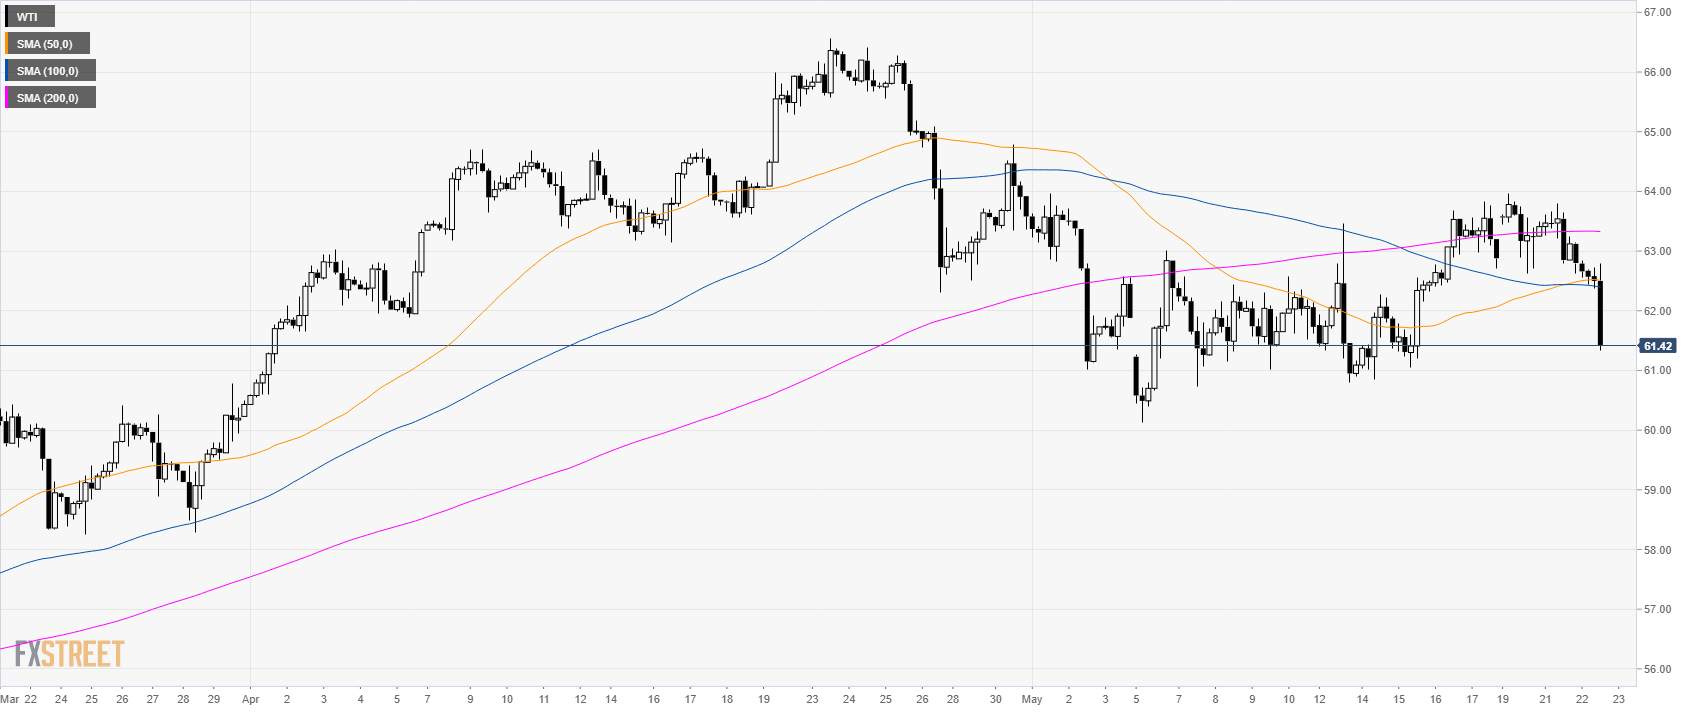
Oil 4-hour chart
WTI is dropping down sharply below its main SMAs.
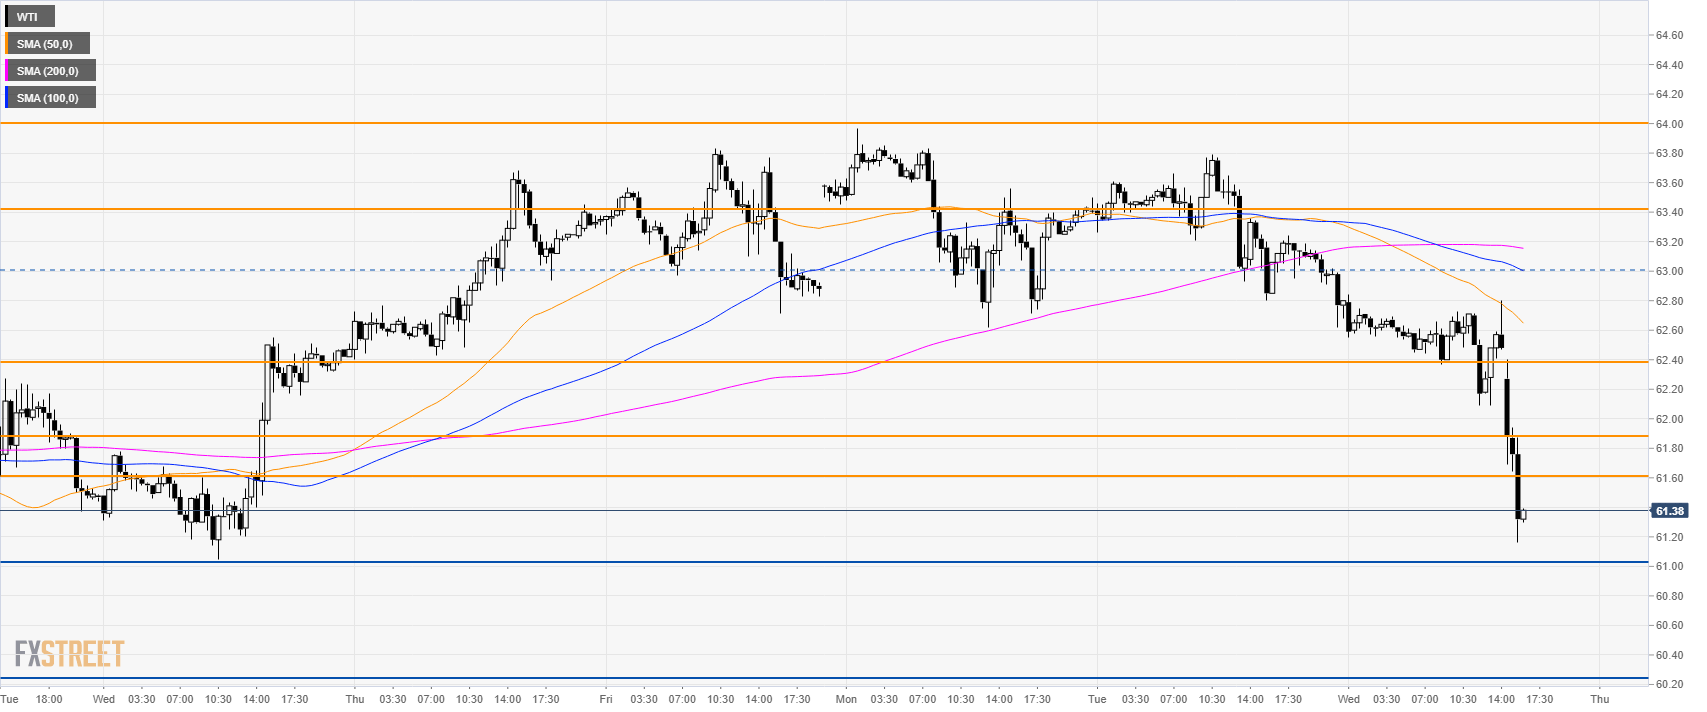
Oil 30-minute chart
WTI is trading towards $61.00 a barrel. If bears can break this level then 60.20 support can come into play. Resistances are seen at 61.60/90 and 62.40 levels.
Additional key levels
