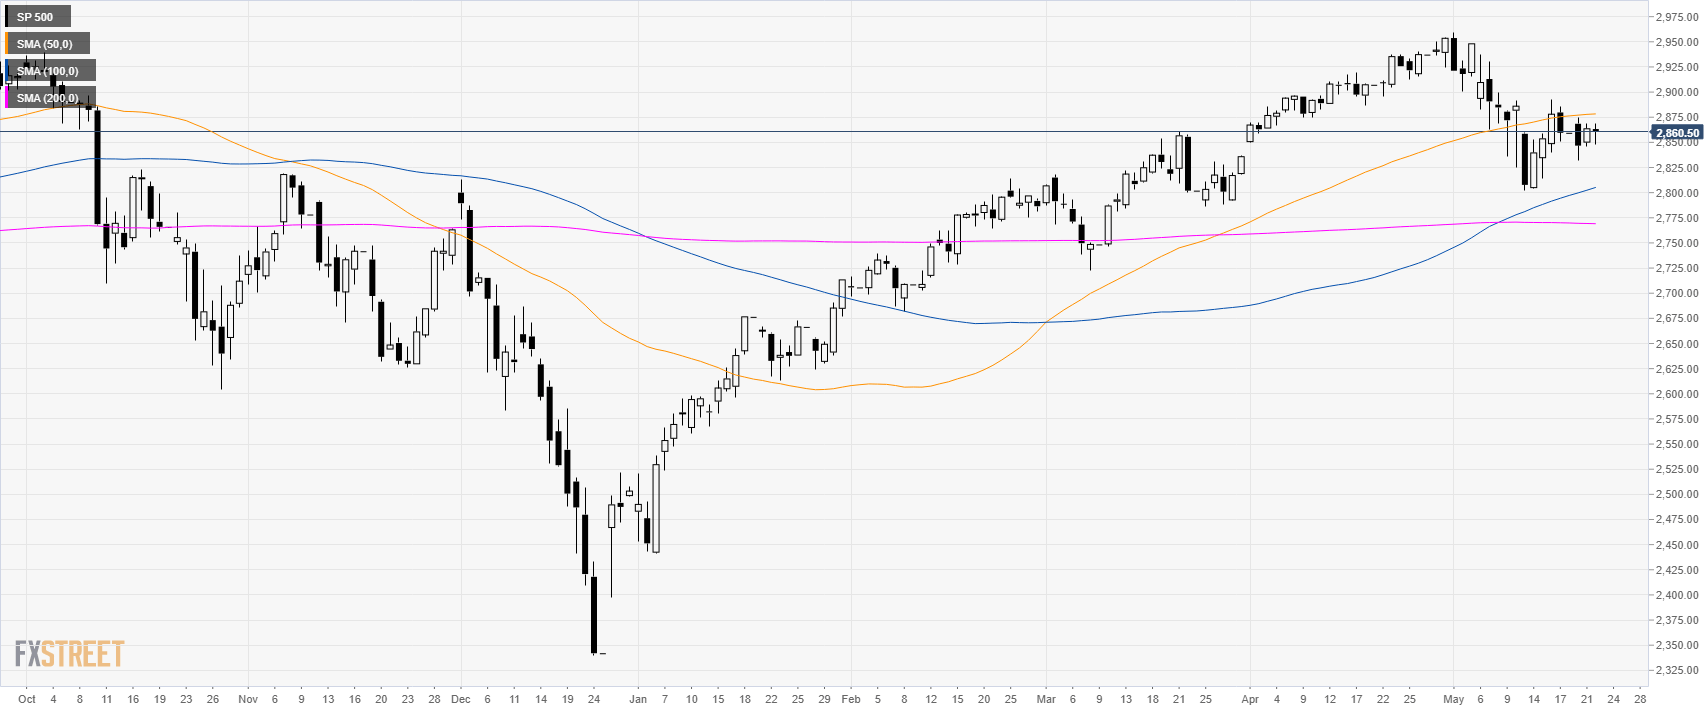
S&P500 daily chart
The S&P500 Index is trading in a bull trend above its 100 and 200-period simple moving averages (SMAs).
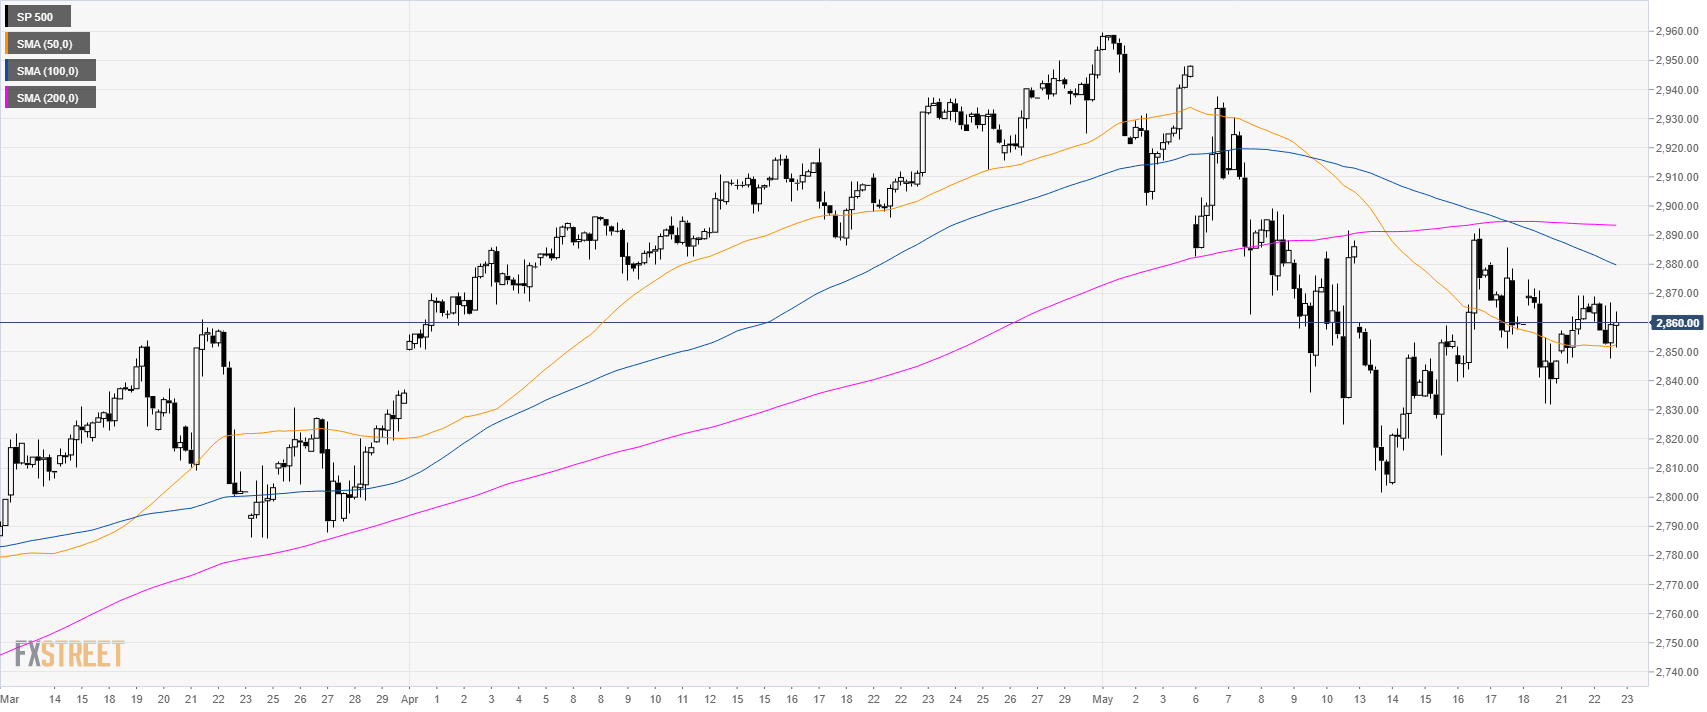
S&P500 4-hour chart
The market is consolidating above 2,830.00 swing low the 50 SMA.
S&P500 30-minute chart
Bulls need to break above 2,870.00 resistance. If the market can break above it then 2,880.00 and 2,890.00 can be back on the cards. Support is at 2,845.00 and 2,835.00 level.
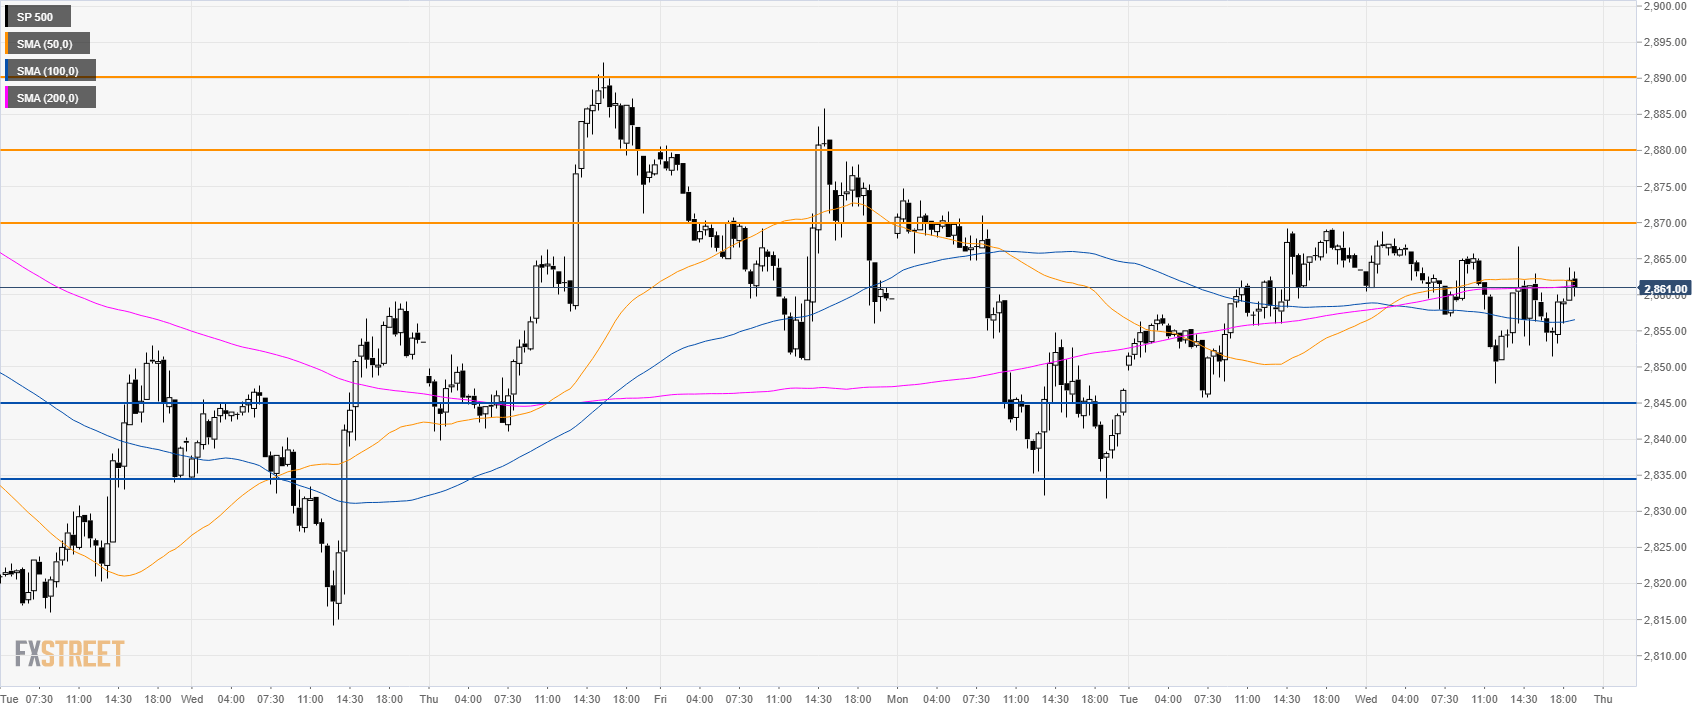
Additional key levels
