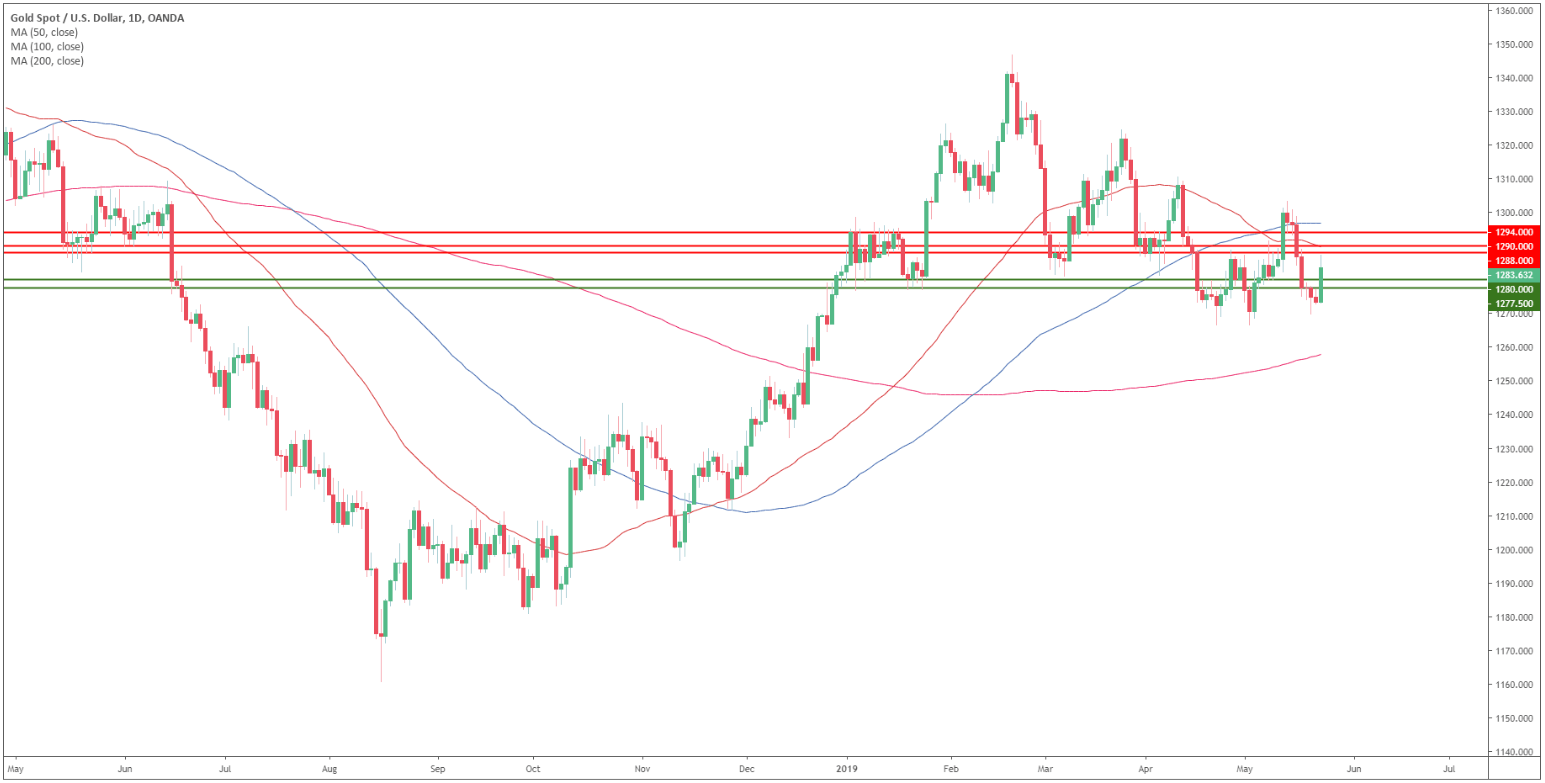
Gold daily chart
Gold is having positive action this Thursday as the market broke above the 1,280.00 mark.
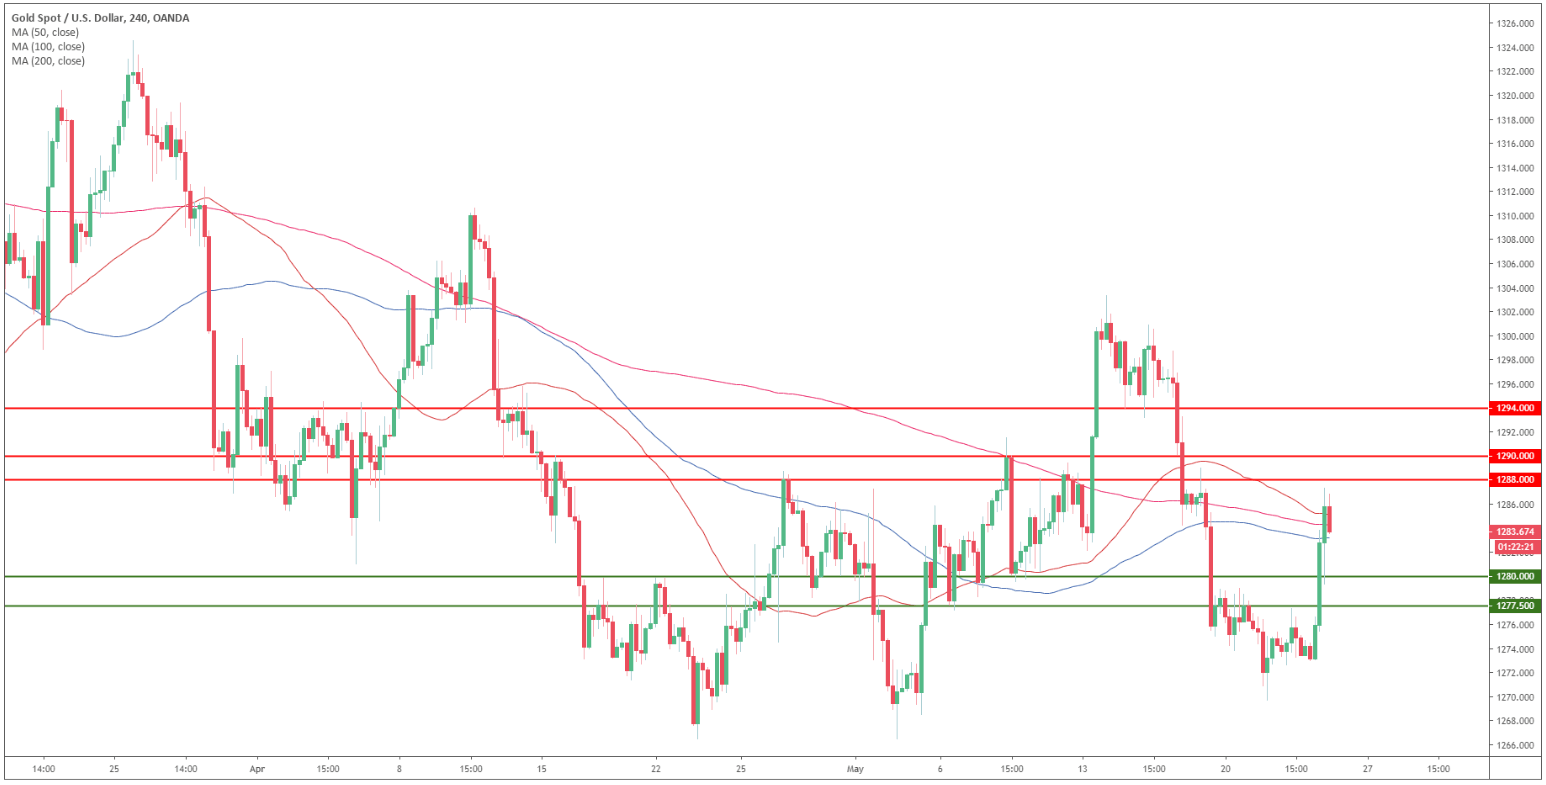
Gold 4-hour chart
Gold pushed into its main simple moving averages (SMAs) near the 1,285.00 level.
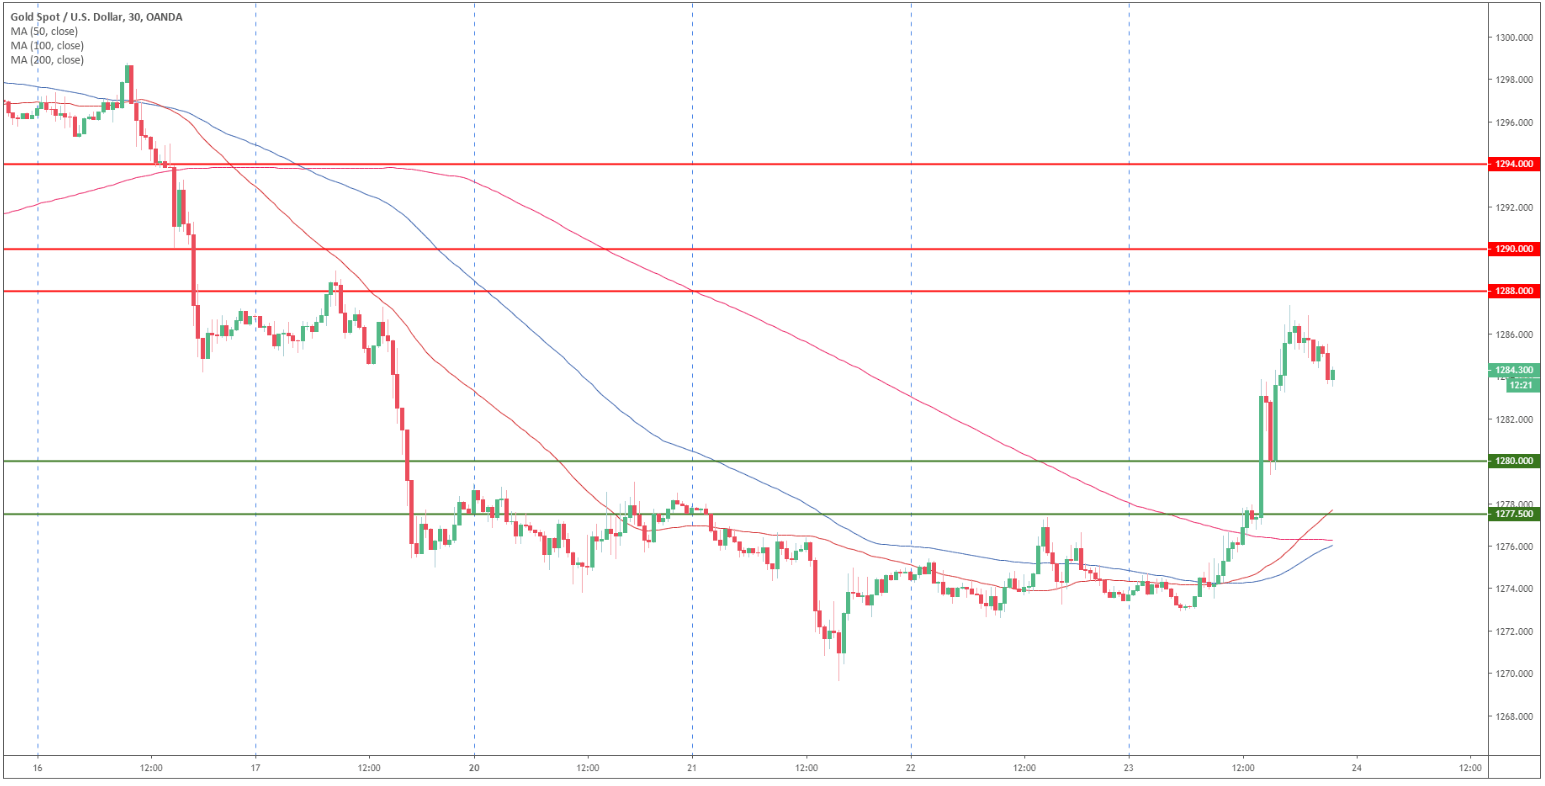
Gold 30-minute chart
The market is trading above1,280.00 and its main SMAs suggesting bullish momentum in the near term. If bulls break 1,288.00 resistance the market can continue to rise towards 1,290.00 and potentially to 1,294.00 if the bulls gather enough steam. Supports are at 1,280.00 and 1,277.50 levels.
Additional key levels
