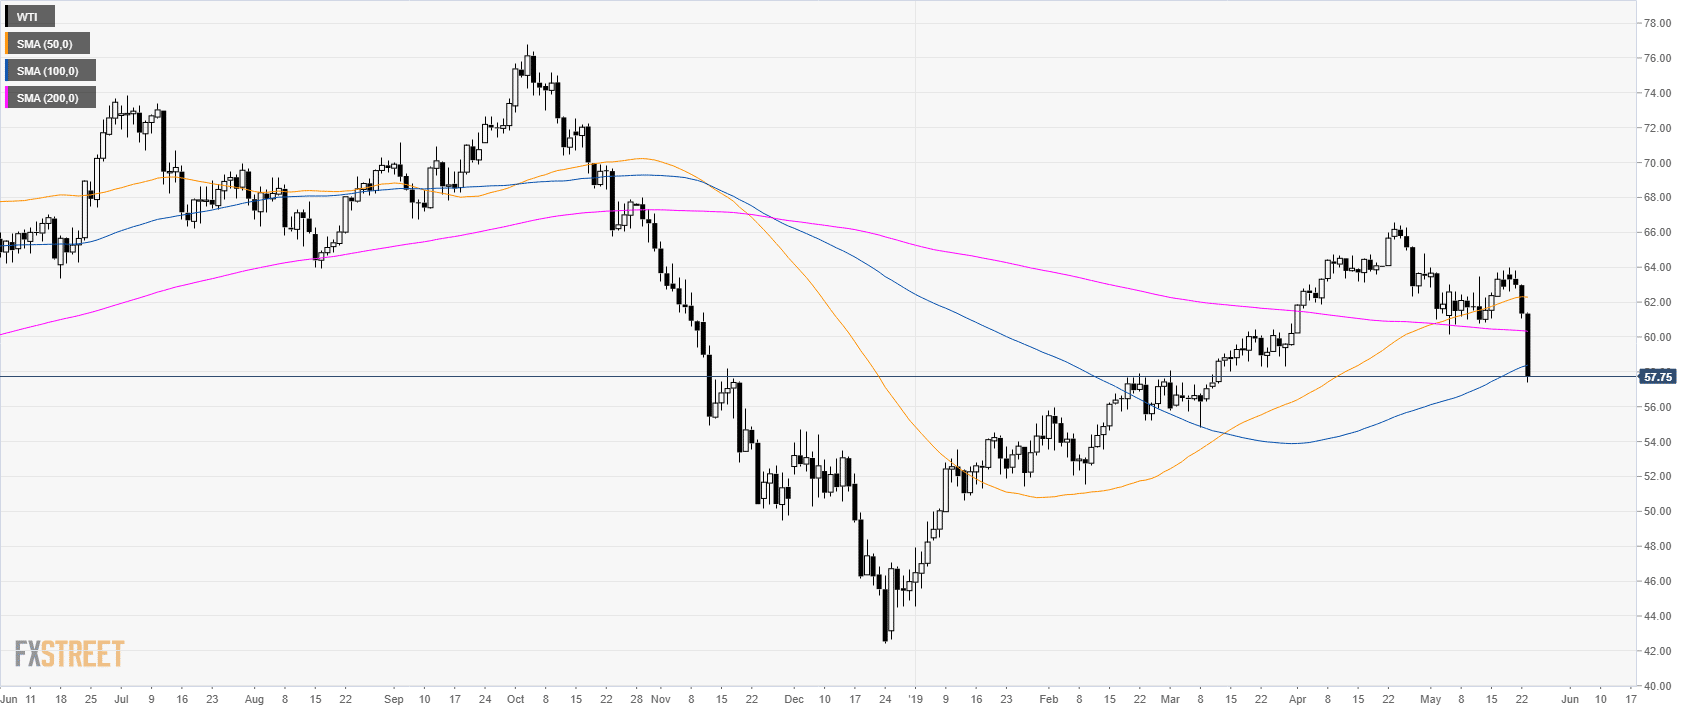
Oil daily chart
On the daily chart, WTI (West Texas Intermediate) is currently having the worst daily decline since December 2018. Bears broke below 58.00 a barrel along with the 200 and 100 simple moving averages (SMAs).
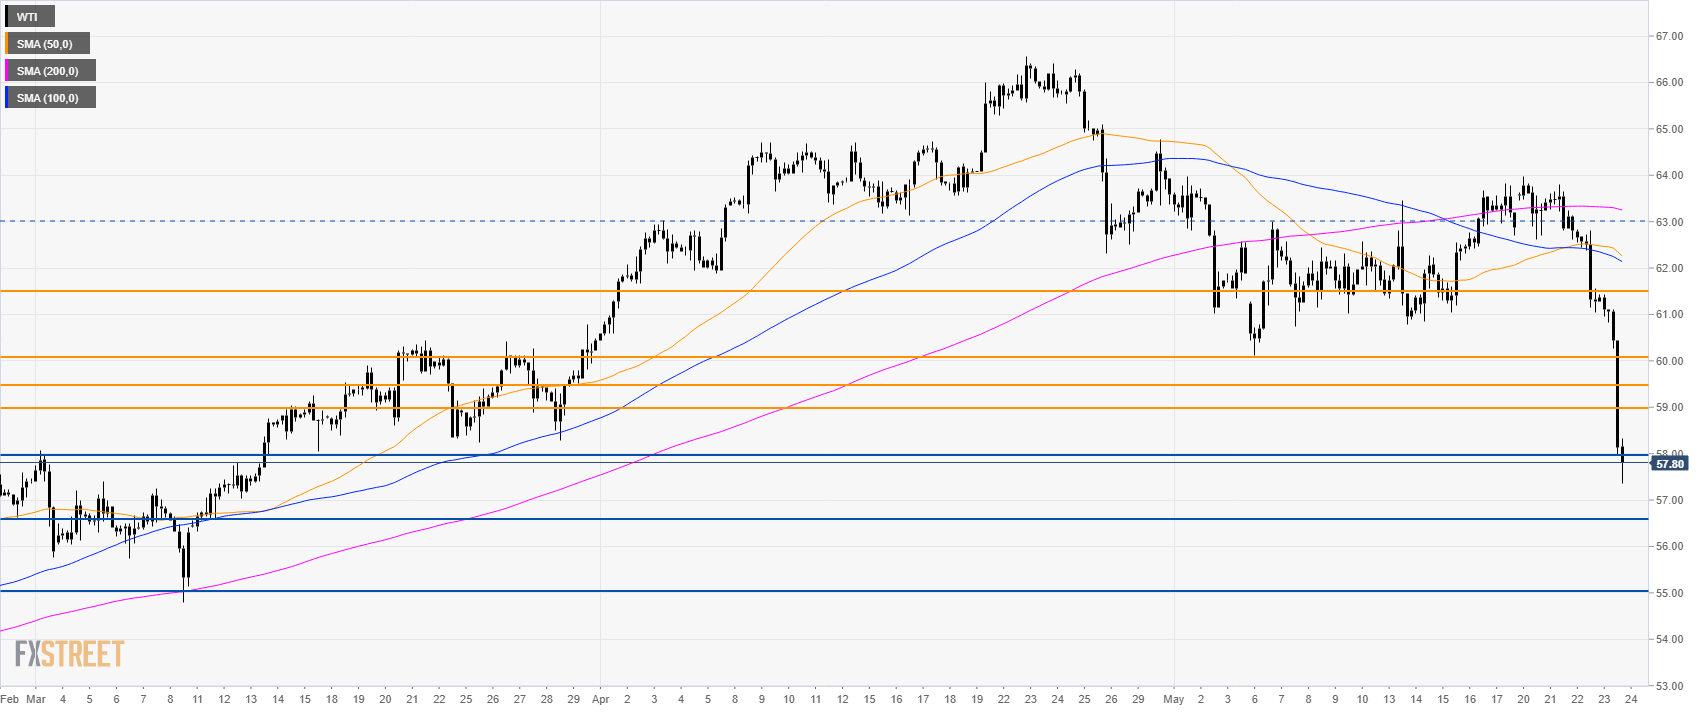
Oil 4-hour chart
WTI is trading below its main SMAs suggesting bearish momentum in the medium term. The market already reached the 58.00 level. Further down lies 56.50 support and the 55.00 figure.
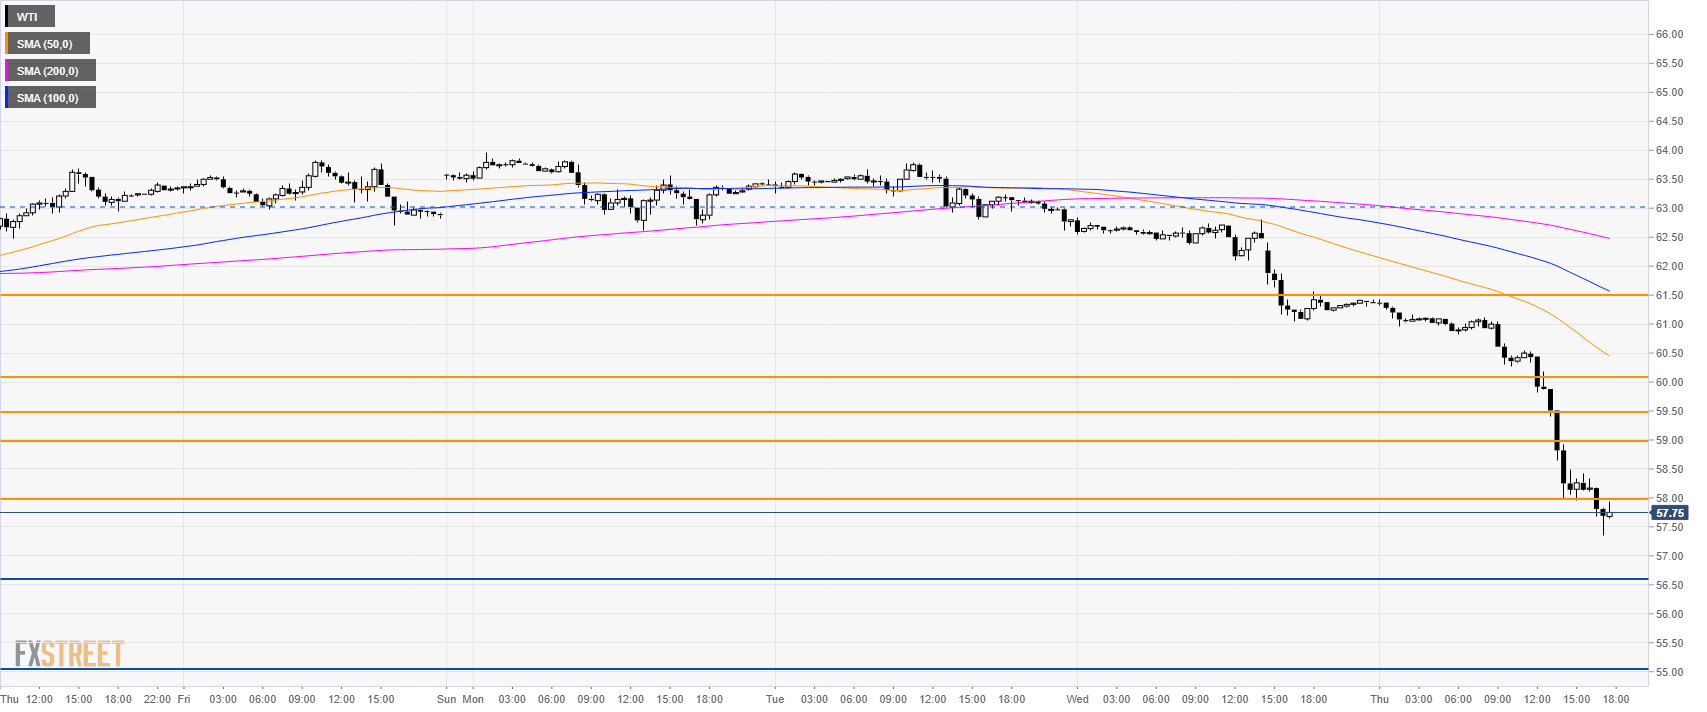
Oil 30-minute chart
Immediate resistances are seen at 58.00, 59.00 and the 59.50 levels.
Additional key levels
