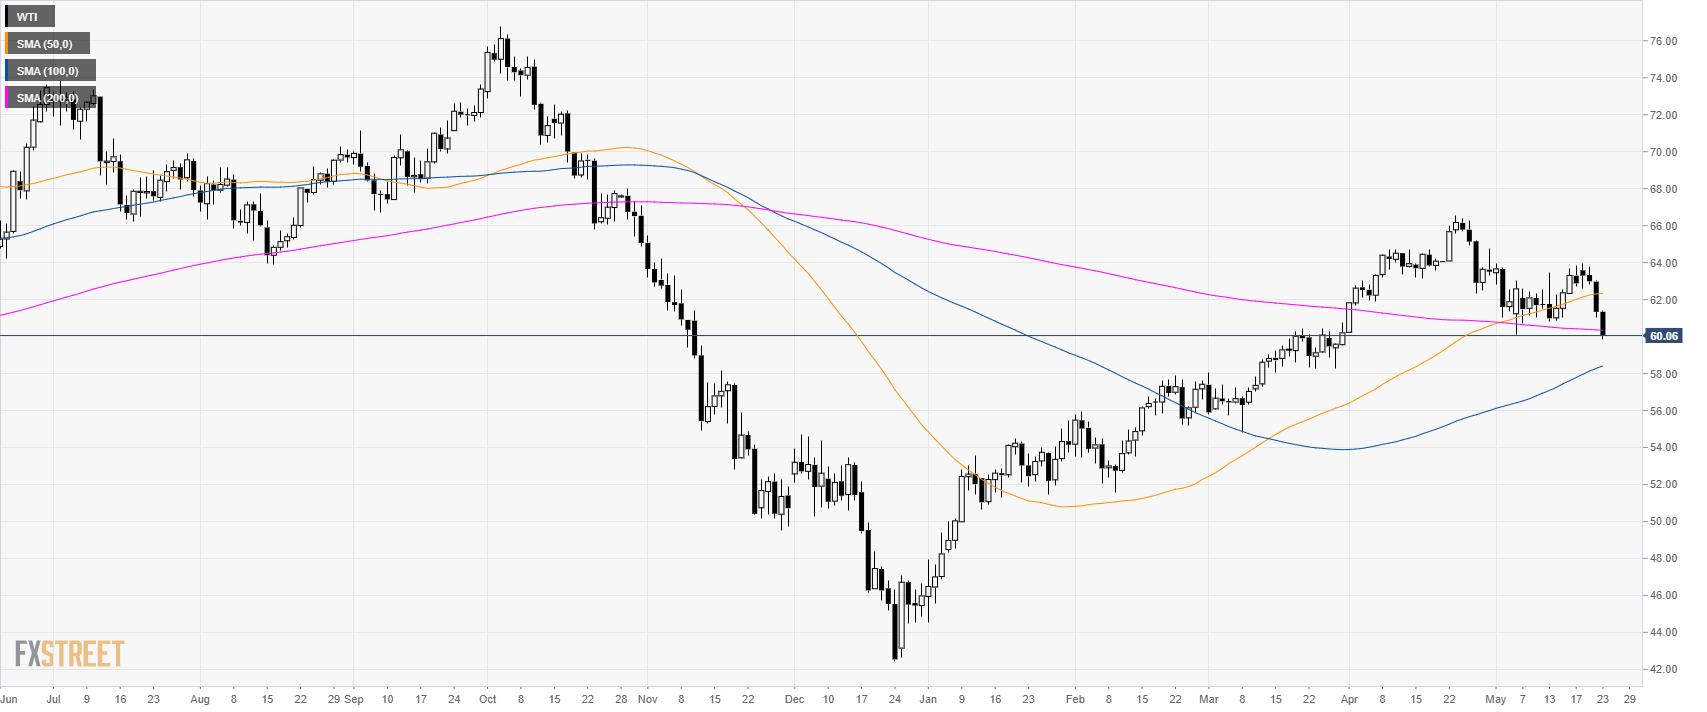
Oil daily chart
On the daily chart, WTI (West Texas Intermediate) is declining sharply as it is now trading at levels not seen since late March. WTI is trading below its 50 simple moving averages (SMAs) while testing the 200 SMA near $60.00 a barrel.
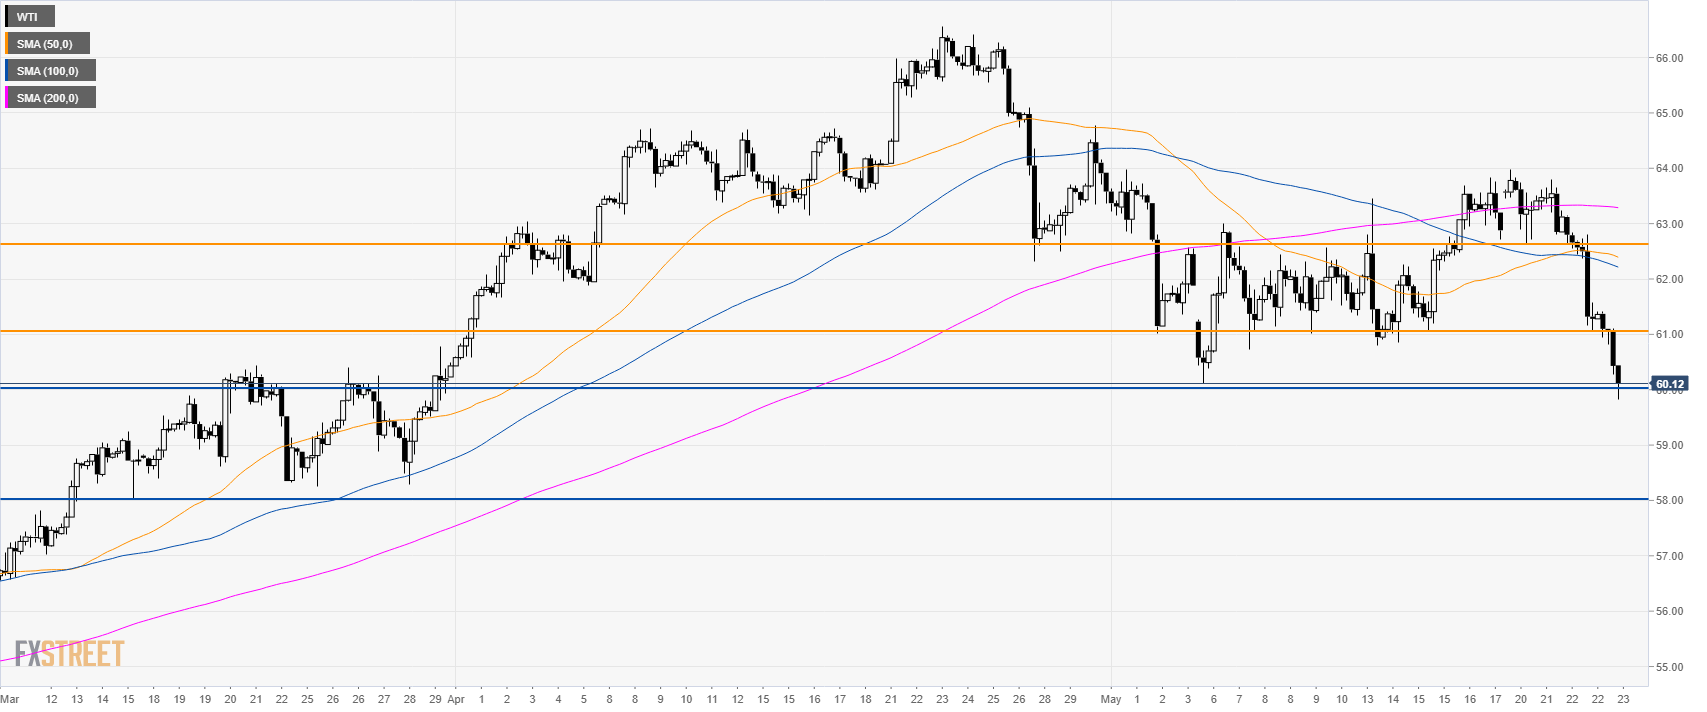
Oil 4-hour chart
WTI is trading below its main SMAs suggesting bearish momentum in the medium term. A break below 60.00 figure can open the gates to the 58.00 support.
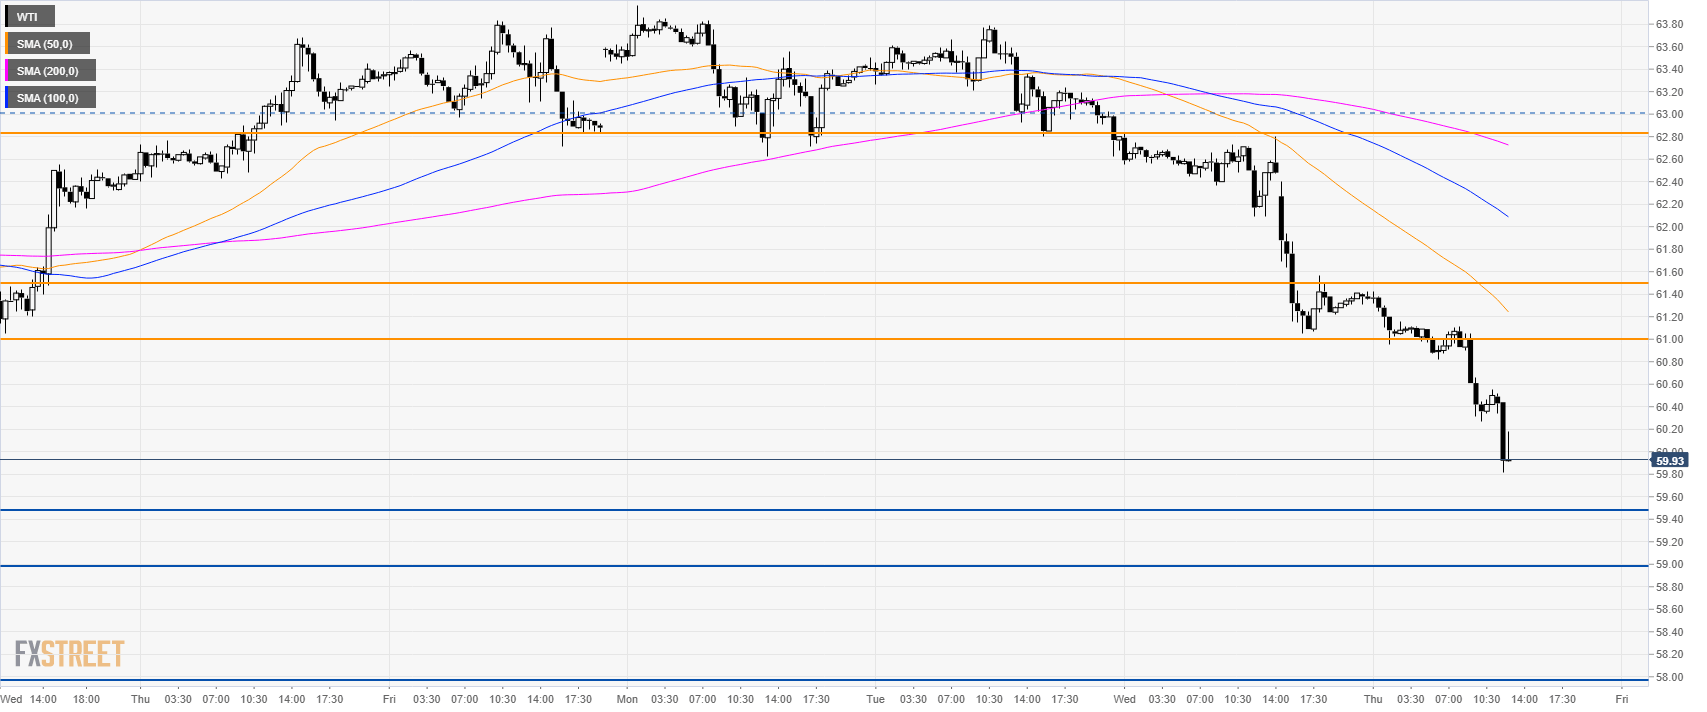
Oil 30-minute chart
In the short term, bears can target 59.50 and the 59.00 figure to the downside. Resistance is seen at 61.50, 61.00 and 62.80 levels.
Additional key levels
