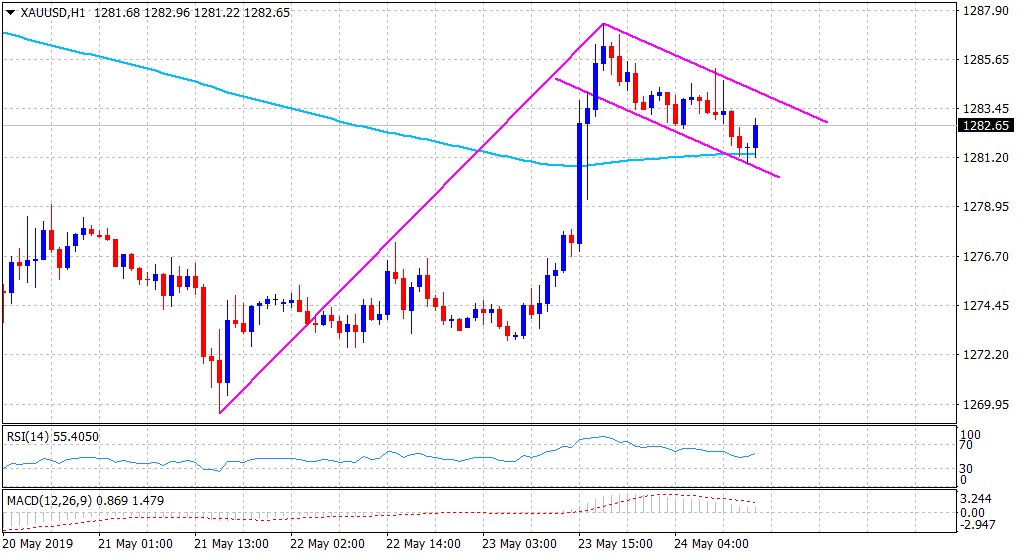
“¢ Gold failed to capitalize on the overnight strong up-move to weekly tops and has been retreating along a descending trend-channel formation on the 1-hourly chart.
“¢ Given this week’s goodish bounce from near three-week lows, the mentioned channel constitutes towards the formation of a bullish continuation – flag chart pattern.
The lower end of the descending trend-channel coincides with 200-hour EMA support and should act as a key pivotal point for intraday traders. Failure to defend the said confluence support would negate the bullish set-up and accelerate the slide back towards a horizontal resistance break-point around the $1278-77 region.
Meanwhile, technical indicators on hourly charts maintained their bullish bias and have also recovered from the negative territory on the daily chart. A convincing break through trend-channel resistance, and a subsequent move beyond the overnight swing high, around the $1286 area will further credence to the constructive outlook.
On a sustained move beyond the mentioned barriers, the commodity seems all set to extend the positive momentum further towards reclaiming the key $1300 psychological mark before aiming to surpass monthly swing highs, near the $1303 region.
Gold 1-hourly chart