- RSI near oversold area helps the medium-term moving average to stop further downside.
- Prices remain under pressure unless recovering back beyond support-turned-resistance.
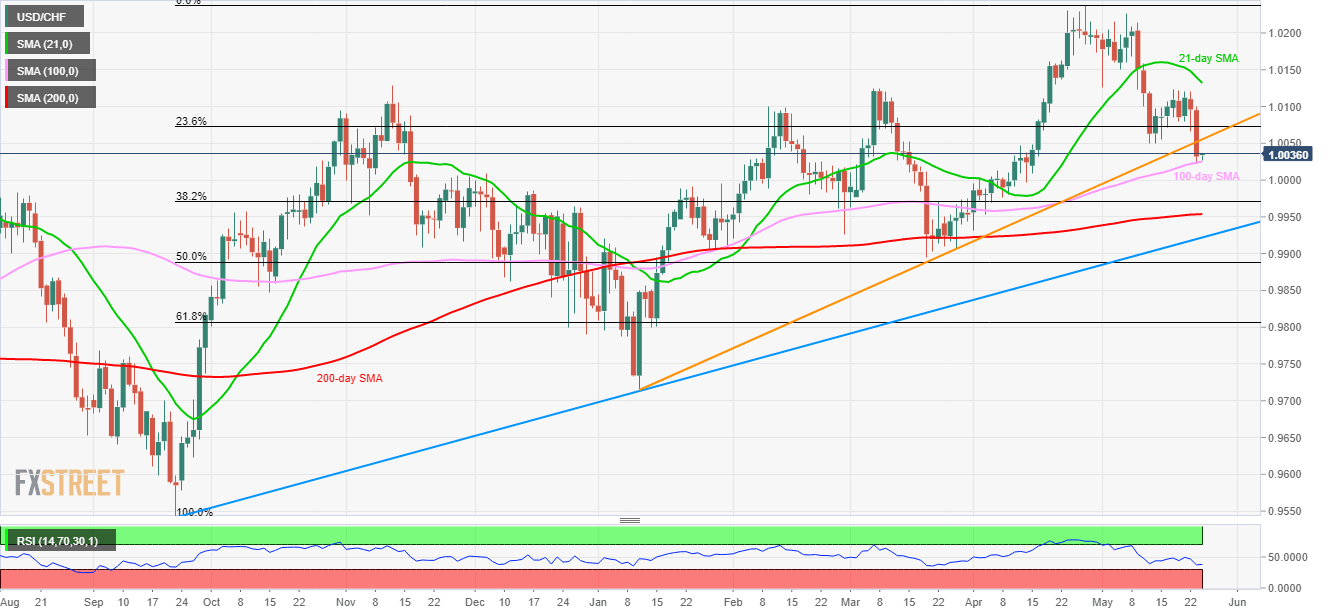
Despite breaking an ascending trend-line since January, 100-day SMA triggers the USD/CHF pair’s pullback as it trades near 1.0030 by the initial Asian session on Friday.
With the 14-day relative strength index (RSI) also being near to oversold region, prices can extend the latest recovery towards previous support-line (now resistance) around 1.0055 with 1.0085 and 1.0125 likely following upside levels to please buyers.
However, 21-day simple moving average (SMA), at 1.0135 now, can question the quote’s increase past-1.0125, if not then April month tops near 1.0240 may be challenged.
Meanwhile, 100-day SMA level of 1.0025 becomes immediate support to watch as a break of which could extend recent downside to 1.000 psychological magnet and then to 200-day SMA level of 0.9953.
During the quote’s additional weakness under 0.9953, a rising trend-line since September 2018 could be of importance to watch for sellers as a break of 0.9922 can recall 0.9860 back to the play.
USD/CHF daily chart
Trend: Pullback expected
