“¢ Gold once again struggled to make it through the $1287-88 supply zone and lost some ground on Tuesday amid a modest pickup in the USD demand.
“¢ Meanwhile, the intraday slide managed to find some support near 200-hour SMA, which coincides with 38.2% Fibo. level of the $1303-$1270 recent slide.
Given that the commodity failed to capitalize on Friday’s breakthrough a bullish continuation – flag chart pattern on the 1-hourly chart, a sustained break through the mentioned confluence support might act as a key trigger for bearish traders and accelerate the fall towards the $1278-77 horizontal support.
Technical indicators on the 1-hourly chart maintained their bearish bias but have held in the neutral territory on the daily chart and thus, warrant some caution for short-term traders before positioning aggressively for the next leg of a directional move.
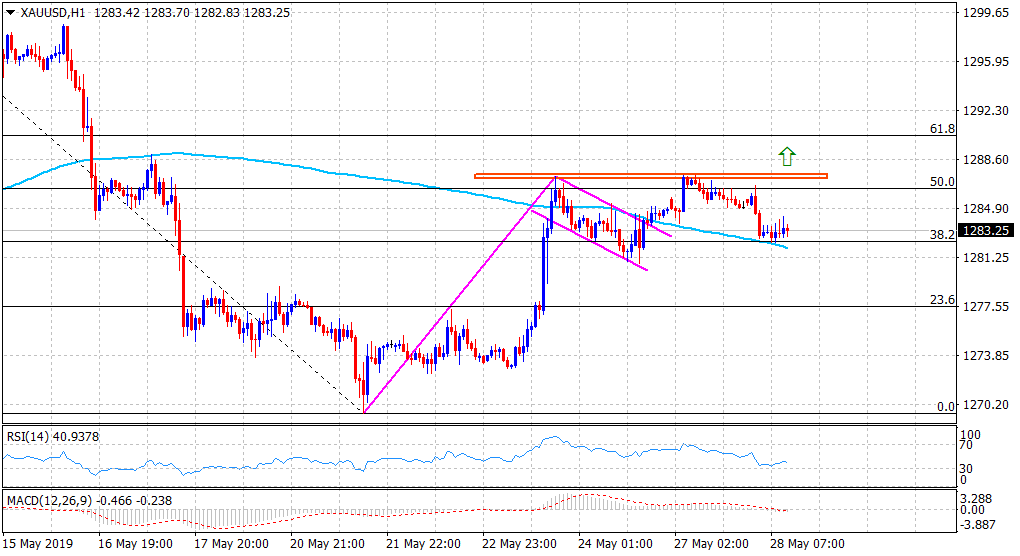
On the flip side, a convincing break through the $1287-88 supply zone now seems to pave the way for a further near-term appreciating move towards $1293-95 intermediate resistance en-route the key $1300 psychological mark and the recent swing highs, around the $1303 region.
Gold 1-hourly chart