- Bounce from near-term DMA again highlights 200-day SMA resistance.
- 50% Fibonacci retracement can limit declines under 21-day SMA.
Having successfully reversed from the 21-day simple moving average (SMA/DMA), the USD/IDR pair is on the bids near 14,455 during initial Tuesday.
Considering the pair’s strong upside momentum on the back of a U-turn from near-term important SMA, 200-day SMA level of 14,475 becomes immediate resistance to watch.
Should prices manage to clear 14,475 upside barrier, 14,550 may offer an intermediate a halt during its rally towards 14,610 trend-line resistance.
Additionally, pair’s sustained rise past14,610 enables it to aim for late-December 2018 high near 14,725.
Meanwhile, a downside break of 21-day SMA level of 14,375 can fetch the quote to 50% Fibonacci retracement of its December to February downturn, at 14,290, a break of which highlights 14,150 and 14,100 for sellers.
In a case where bears keep dominating under 14,100, 14,000 and April month low near 13,970 may come back on the chart.
USD/IDR daily chart
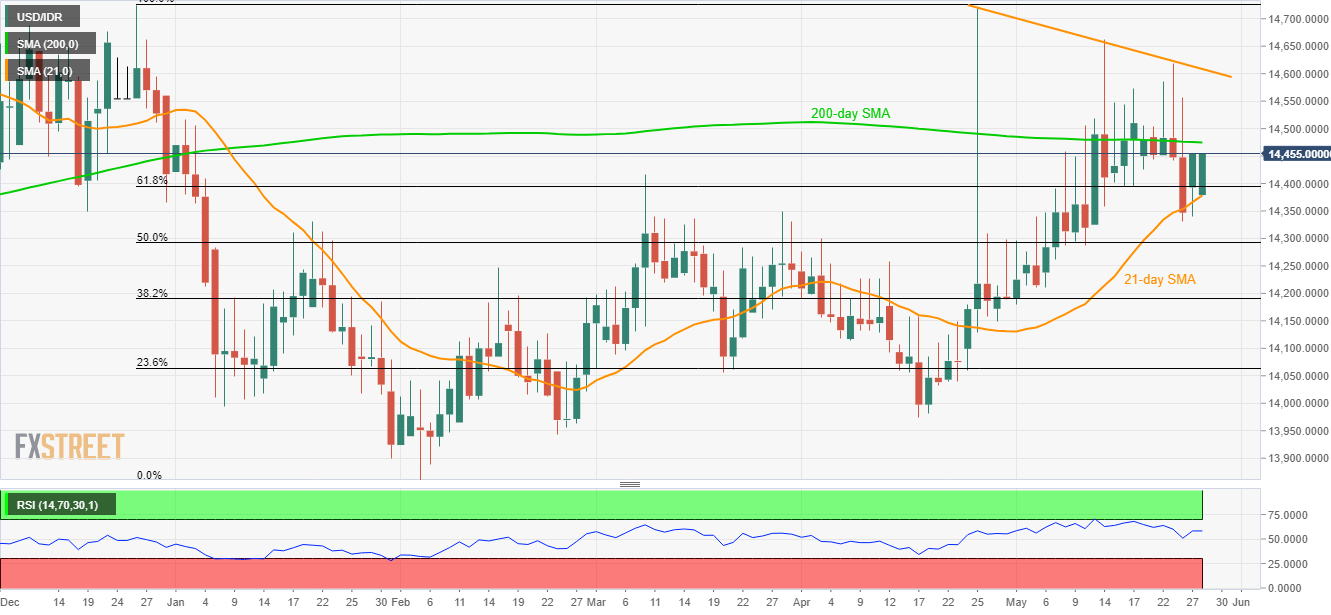
Trend: Positive
