- DXY is up for the third consecutive day.
- The 2019 high is at 98.38, can the bulls reach that level?
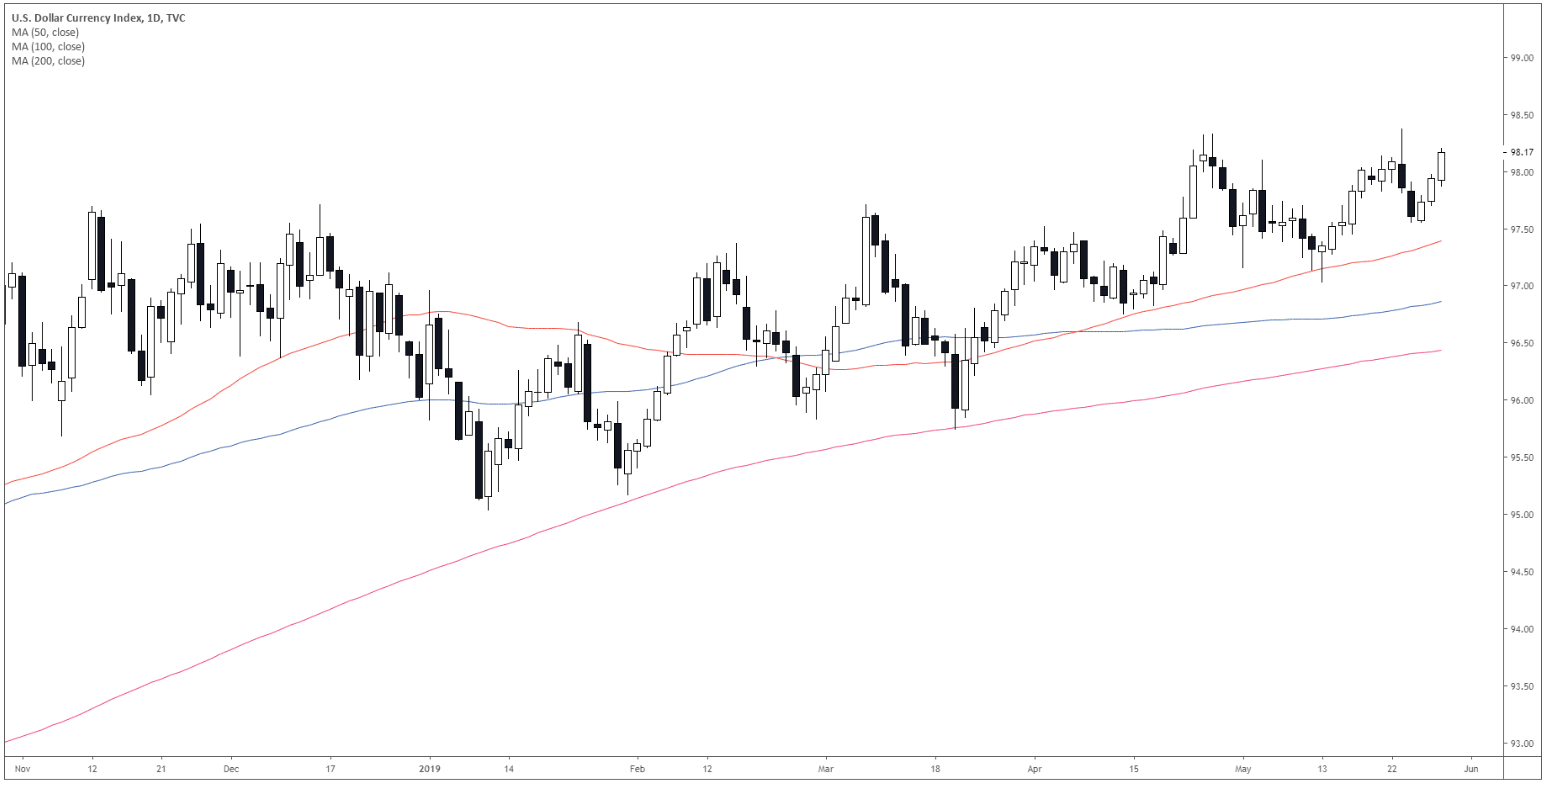
DXY daily chart
The US Dollar Index (DXY) is in a bull trend above its main simple moving averages (SMAs).
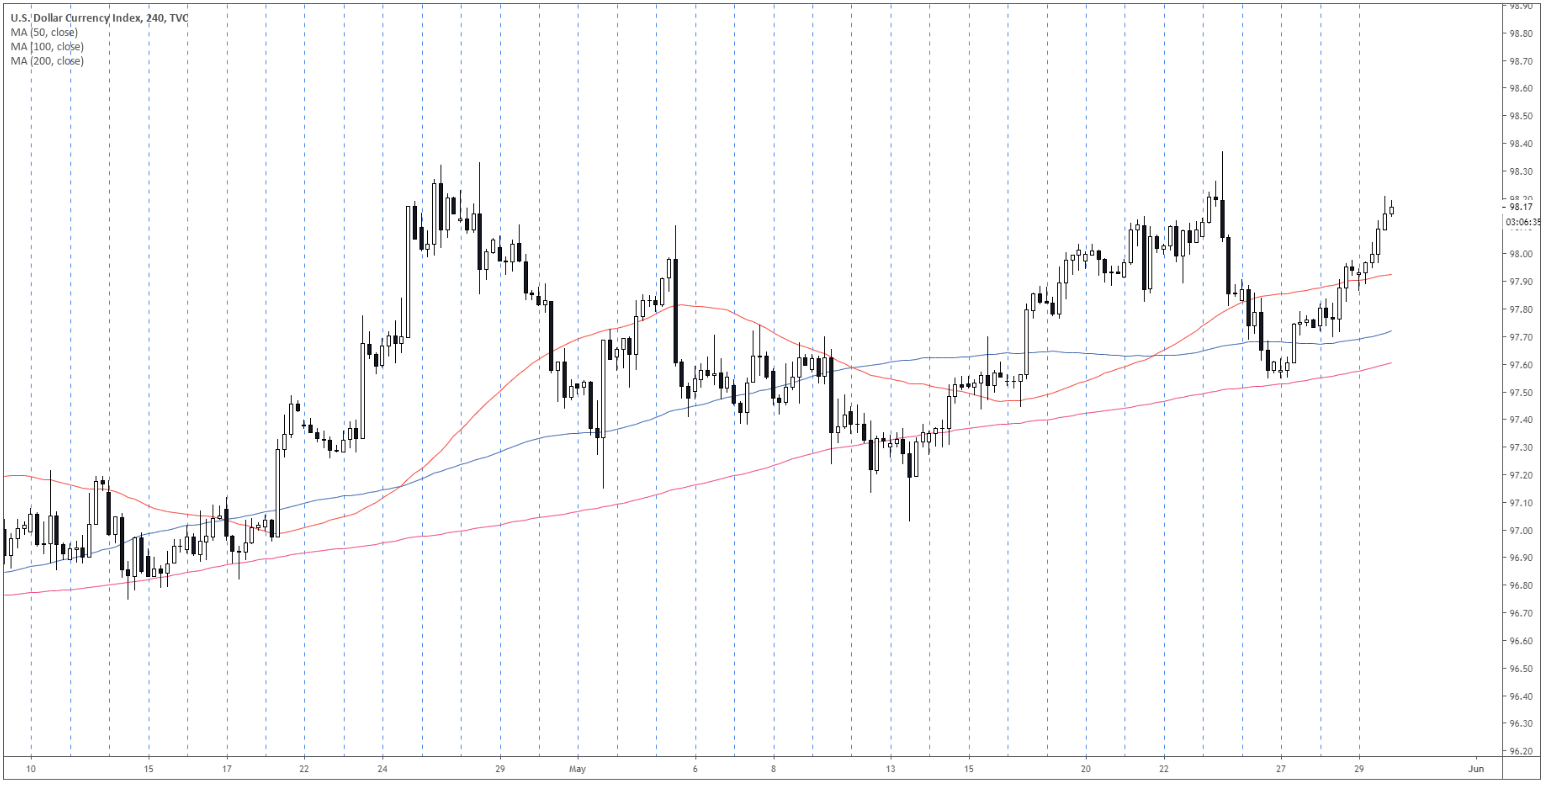
DXY 4-hour chart
The buck is trading above its main SMAs suggesting bullish bias in the medium term.
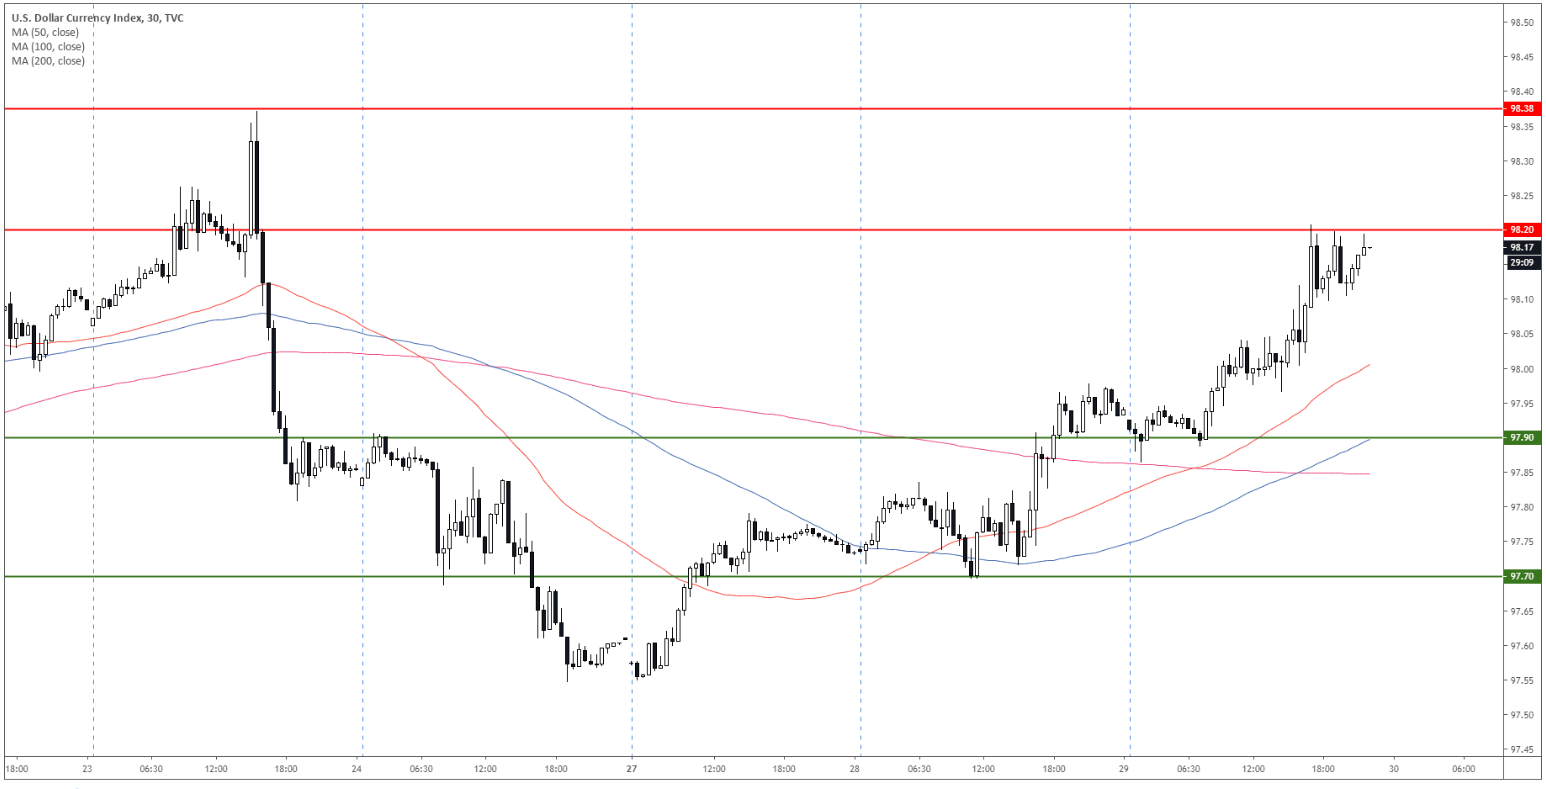
DXY 30-minute chart
DXY reached the 98.20 resistance (discussed on Tuesday). A breakout above that level can lead to the 2019 high at 98.38. On the flip side, if the market is unable to surpass the 98.20 resistance, DXY can start declining towards 97.90 and 97.70 support.
Additional key levels
