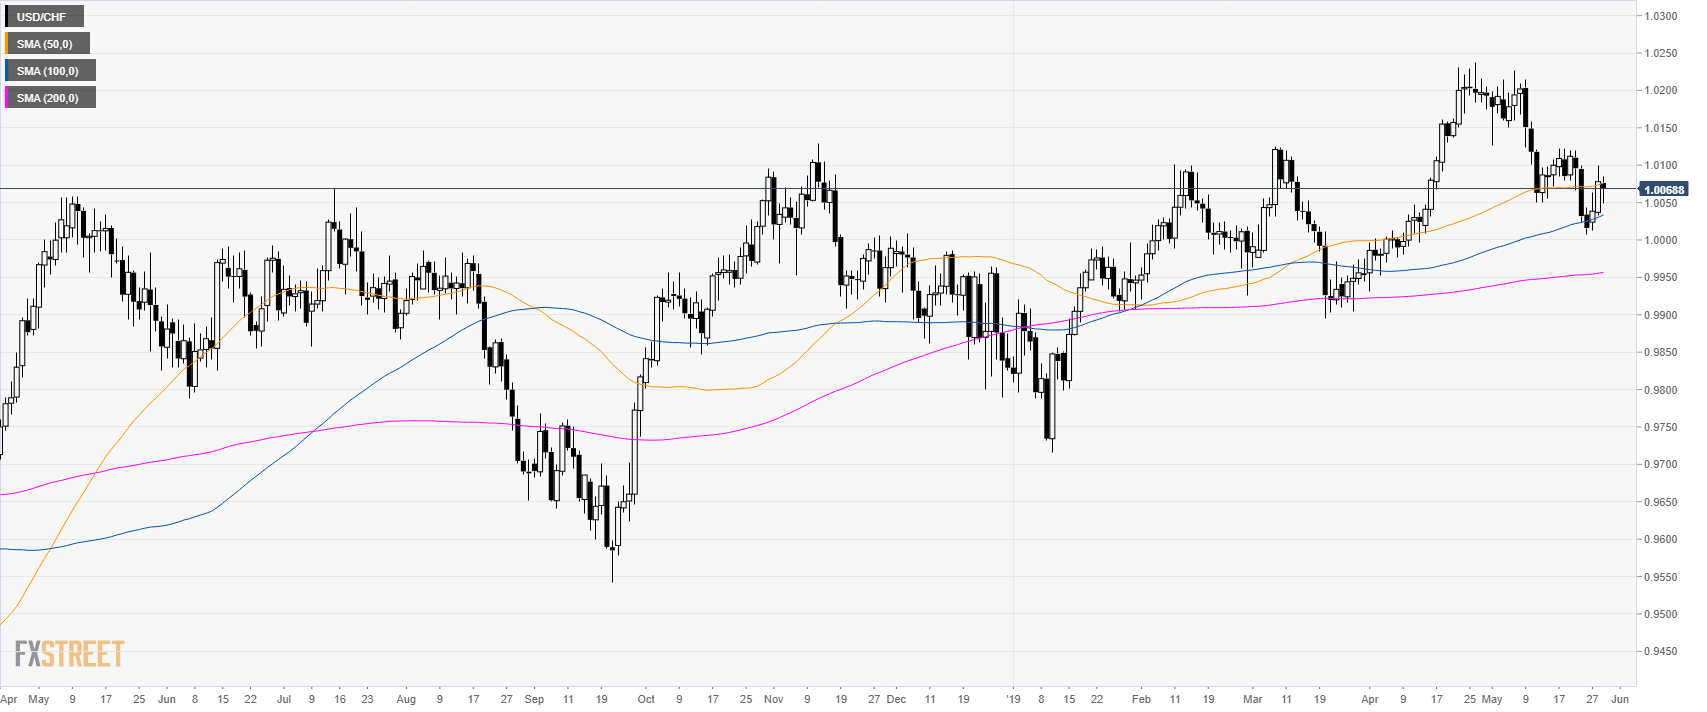
USD/CHF daily chart
USD/CHF is trading back above its 100 and 200 simple moving averages (SMAs).
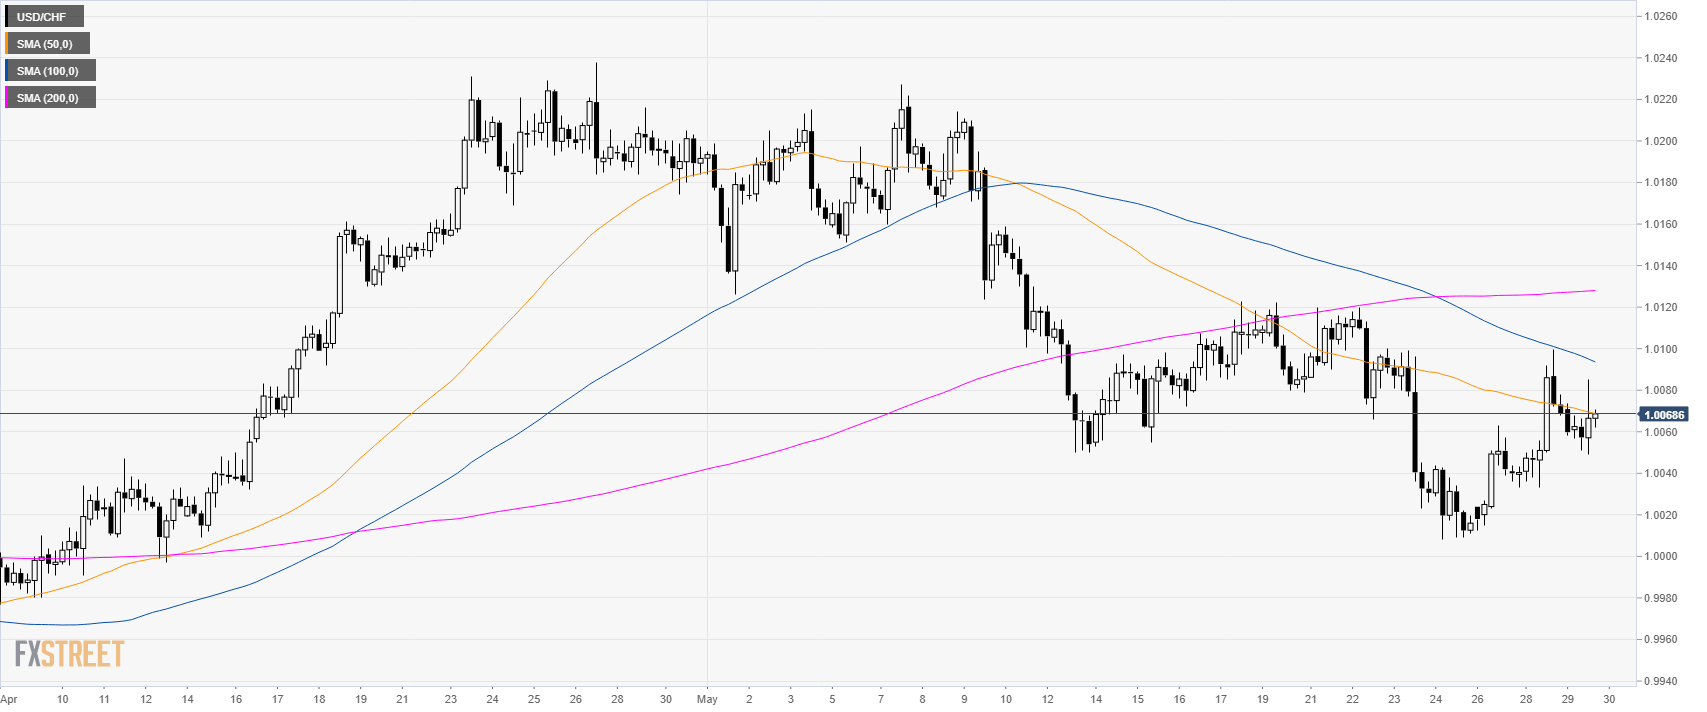
USD/CHF 4-hour chart
USD/CHF is trading below its main SMAs suggesting bearish momentum in the near term.
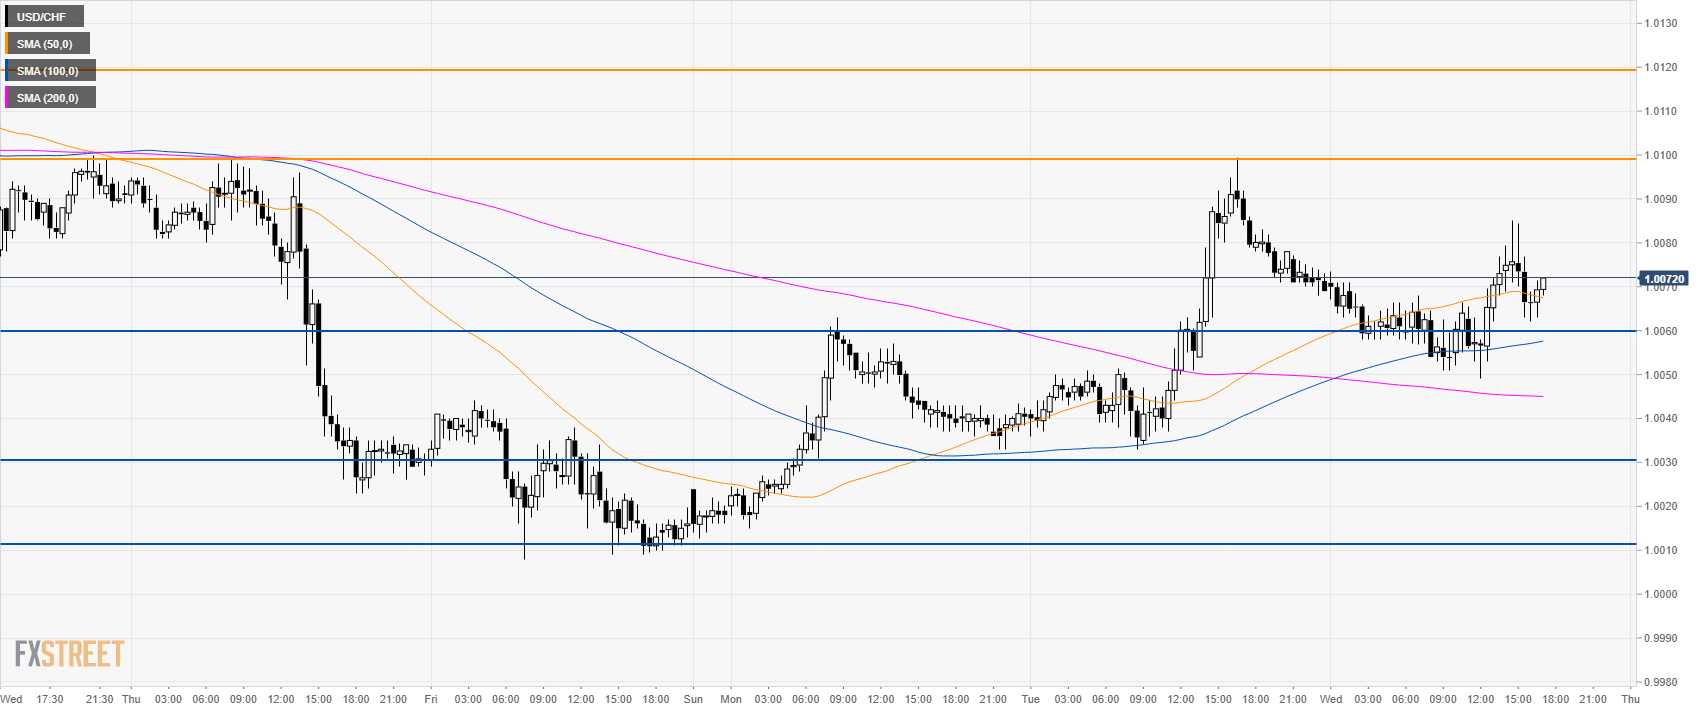
USD/CHF 30-minute chart
USD/CHF attempted to reach the Tuesday high near 1.0100 but found resistance at 1.0085. A breakout above 1.0100 resistance can lead to a move up to 1.0120 level. On the flip side if bears push the market below 1.0060 USD/CHF can start declining towards 1.0030 and potentially to 1.0010 level.
Additional key levels
