- USD/CNH has created a bull flag on the daily chart
- A close above 6.9346 would confirm a flag breakout.
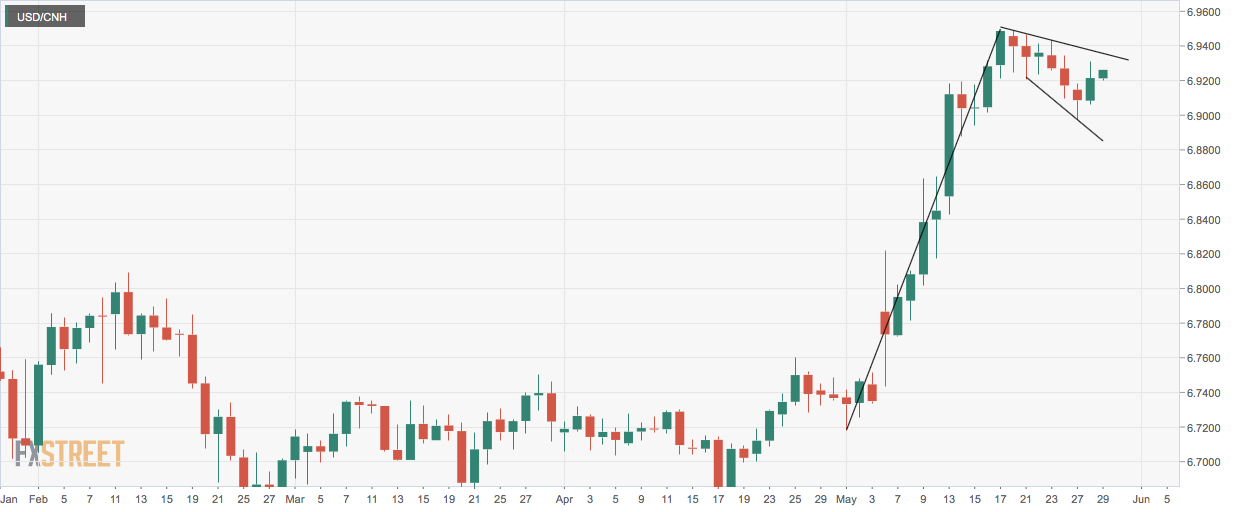
USD/CNH bounced up from 6.8973 on Monday and closed well above 6.92 on Tuesday confirming an end of the pullback from the recent high of 6.95.
More importantly, with the recovery from 6.8973, the pair seems to have formed a bull flag on the daily chart, which is a continuation pattern – a pause that often refreshes higher.
A daily close above the upper edge of the flag, currently at 6.9346, would confirm a flag breakout and open the doors to 7.15 (target as per the measured move method).
A close below Monday’s low of 6.8973 would kill prospects of a bull flag breakout. However, with trade tensions showing no signs of abating, a flag breakout looks likely.
The moving average convergence divergence histogram has indeed turned bearish. It is, however, a lagging indicator.
Daily chart
Trend: Bullish bove 6.9356
Pivot levels
