- 200-day SMA continues to disappoint buyers.
- 50-day SMA and 14,000 seem crucial supports.
Frequent failures to cross 200-day simple moving average (SMA) drags the USD/IDR pair down to near 14,380 during early Wednesday.
50-day SMA (also known as DMA) at 14,250 can be considered as immediate support in addition to 14,300 round-figure.
Also, 14,150, 14,100 and 14,000 may entertain sellers below 14,250 with February month low near 13,860 likely being their favorite during further downside.
Alternatively, a sustained break of 14,475 comprising 200-day SMA becomes pre-requisite for the quote to aim for 14,550 and then to 50% Fibonacci retracement of October to February declines near 14,650.
Given the pair’s extended rise above 14,650, bulls can target 61.8% Fibonacci retracement of 14,830.
USD/IDR daily chart
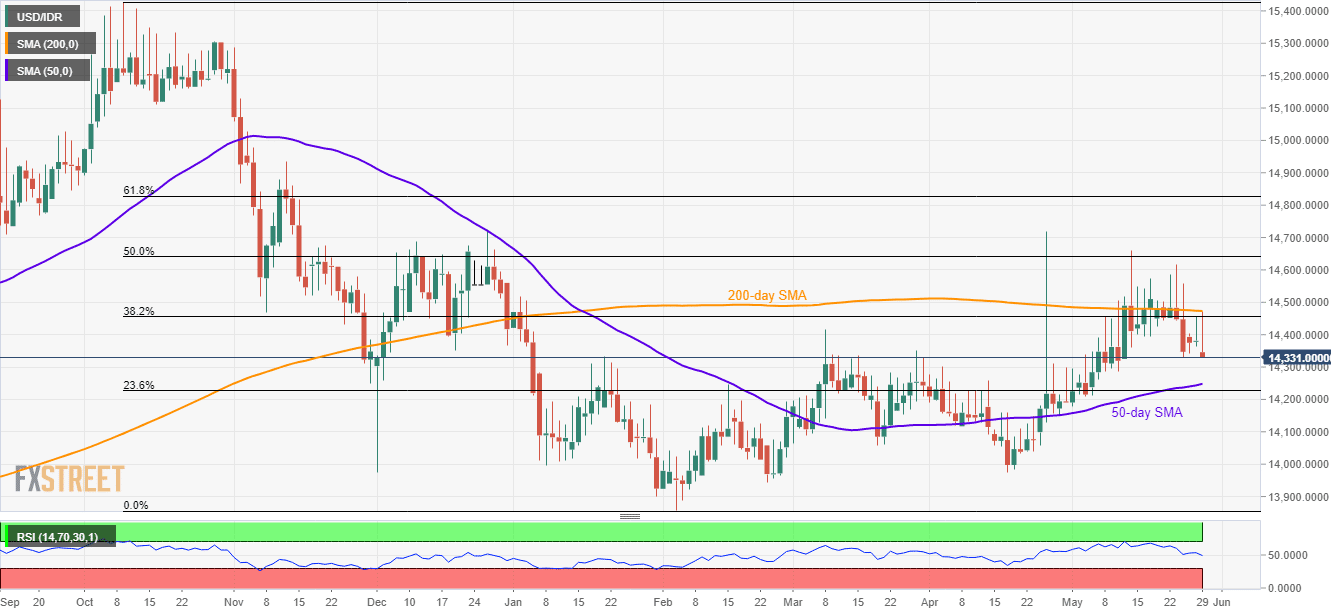
Trend: Bearish
