- 200-day SMA continues to limit the pair’s upside.
- 50-day SMA seems immediate support.
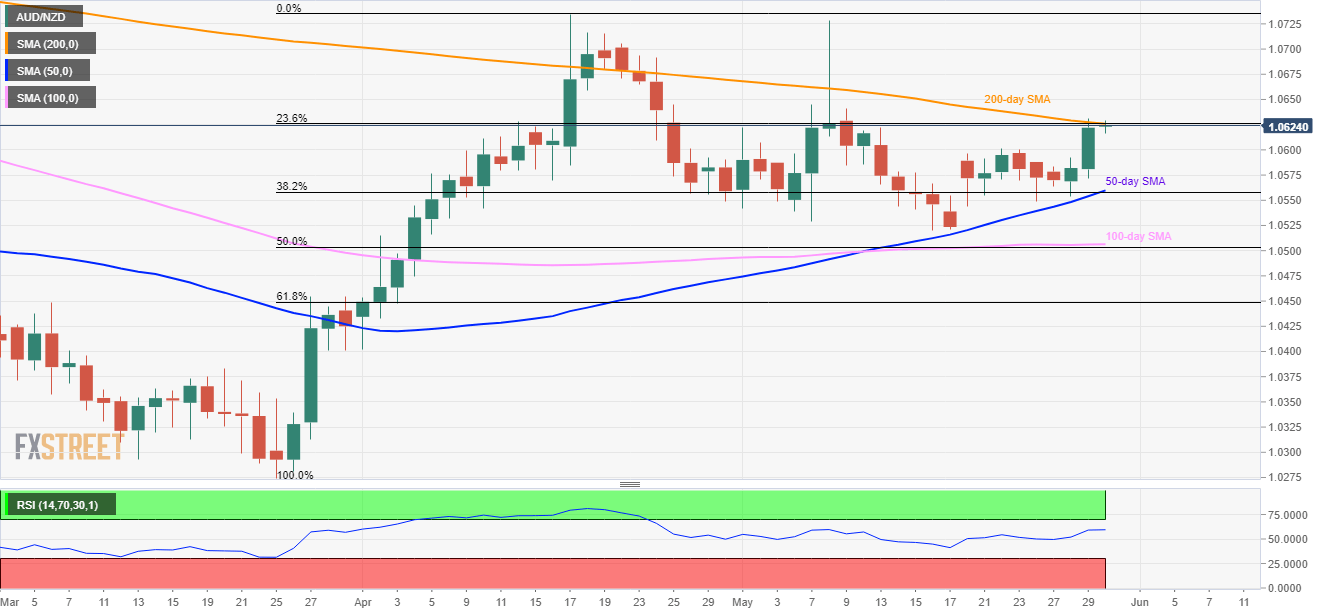
With the big miss in Australia’s private capital expenditure and weaker than expected building permits, AUD/NZD took a step back from 200-day SMA as it seesaws near 1.0625 during early Thursday.
First quarter private capital expenditure slipped beneath +0.5% forecast and +2.0% prior to -1.7$ while monthly building permits dropped below 0.0% market consensus to -4.7% during April.
With 200-day simple moving average (SMA) level of 1.0625 limiting its near-term upside, chances of its drop to 1.0600 can’t be denied ruled out.
However, 50-day SMA level of 1.0560 and 1.0505/1.0500 support confluence comprising 100-day SMA and 50% Fibonacci retracement of March to April upside can confine quote’s further downside.
On the contrary, a successful break of 1.0625 enables the pair to aim for 1.0645 and 1.0670 whereas 1.0720 and 1.0735 could entertain buyers afterward.
AUD/NZD daily chart
Trend: Pullback expected
