- The Canadian Gross Domestic Product (GDP) in the first quarter came in below expectations at 0.4% vs. 0.7% forecast.
- Can bulls pull away from the 1.3500 figure?
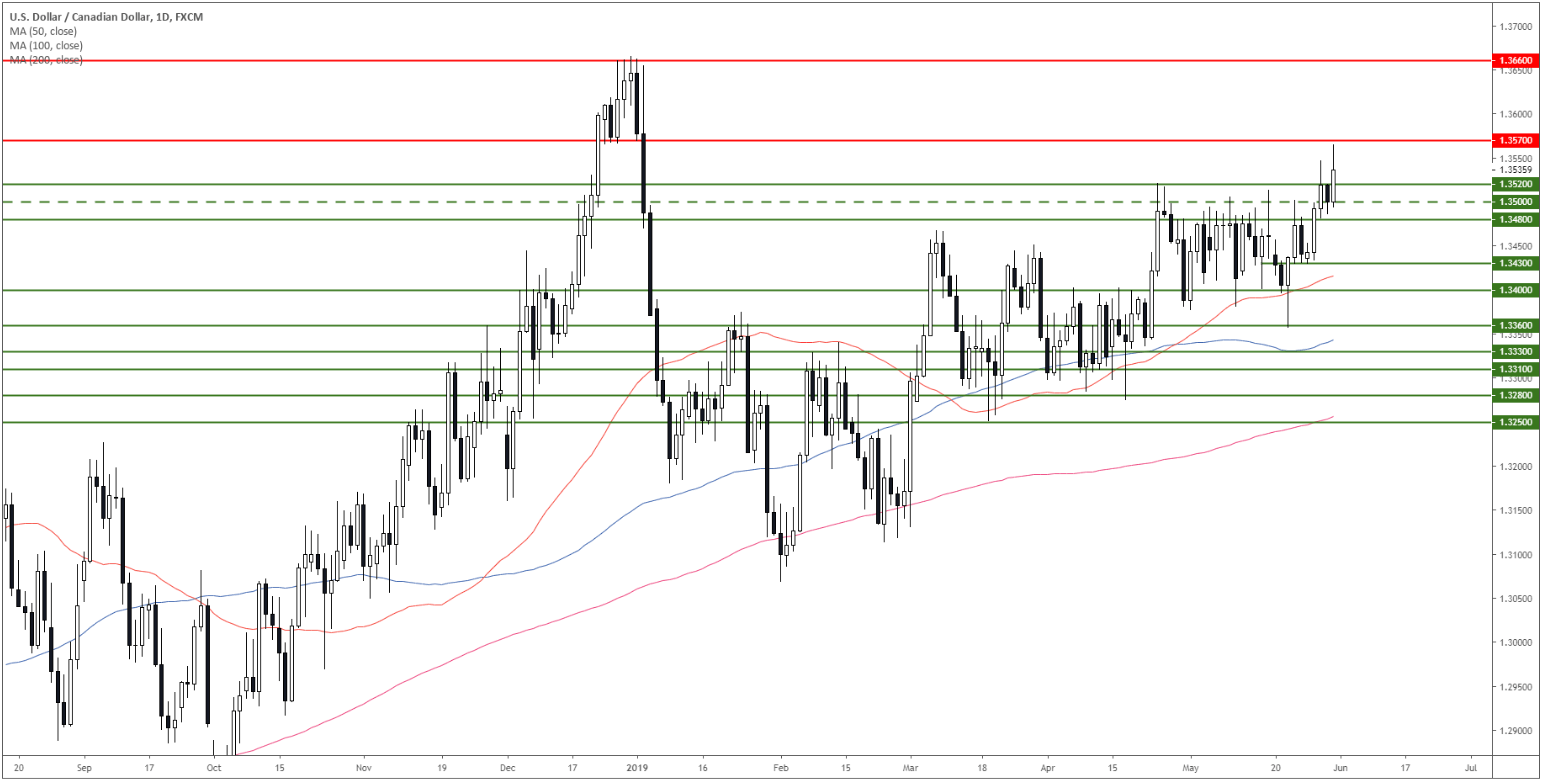
USD/CAD daily chart
USD/CAD almost reached 1.3570 on the release of the Canadian GDP. The market is trading above its main simple moving averages (SMAs).
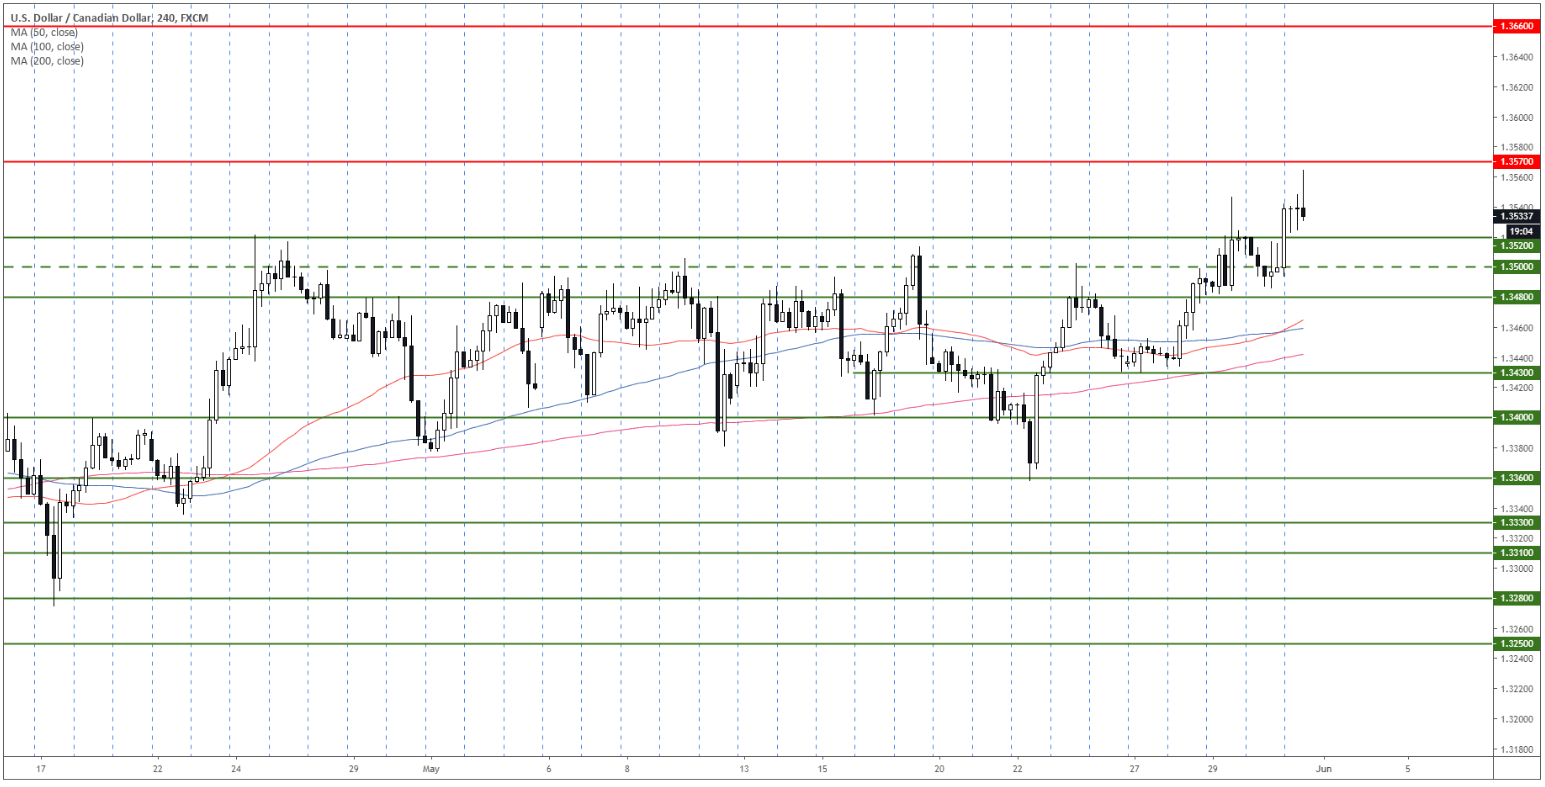
USD/CAD 4-hour chart
USD/CAD is currently finding little acceptance above 1.3570.
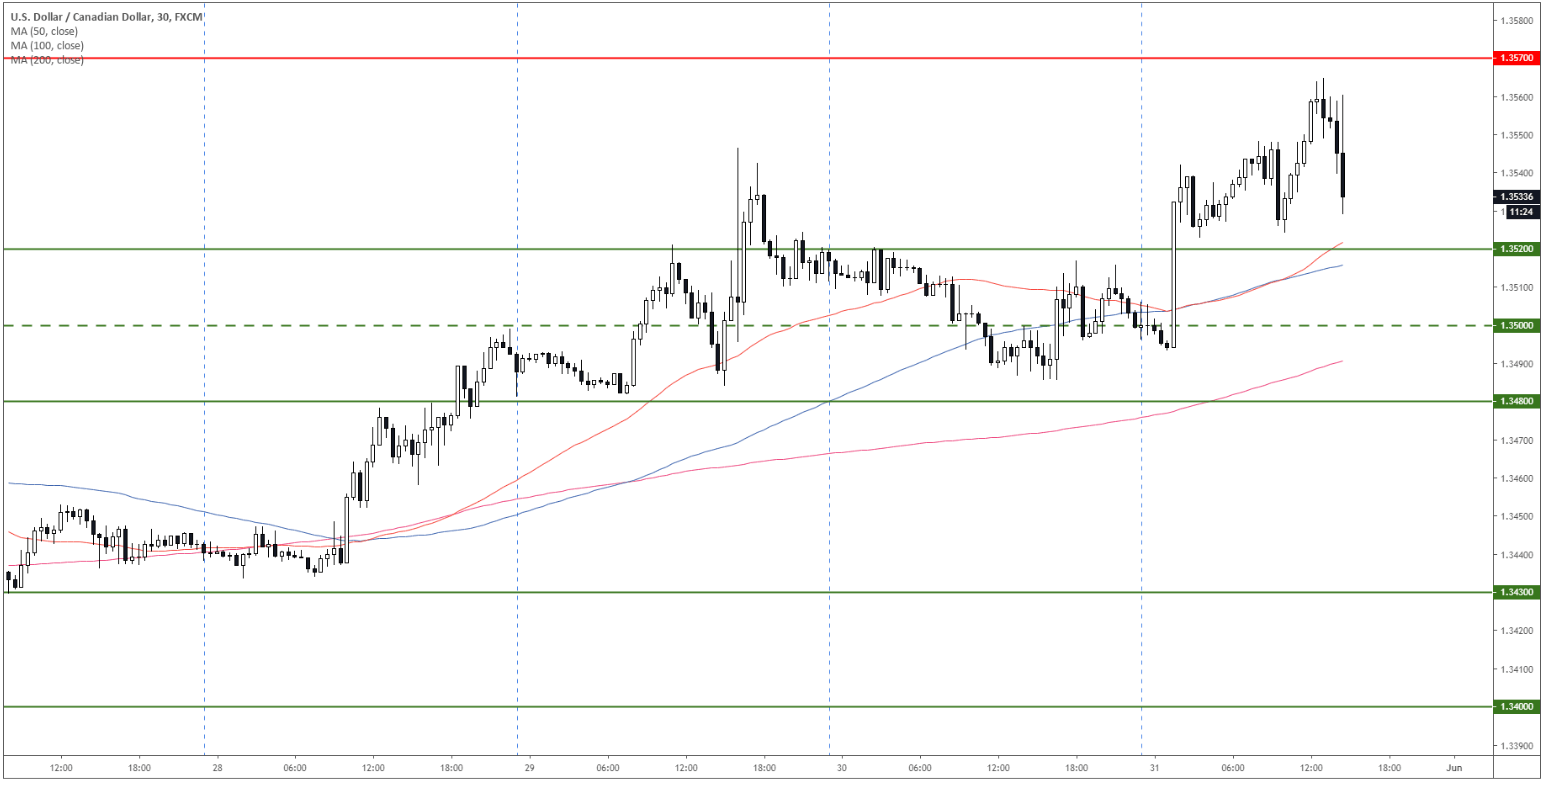
USD/CAD 30-minute chart
USD/CAD is trading above its main SMAs suggesting bullish momentum. However, a break below 1.3520 can lead to a deeper retracement towards 1.3500, 1.3480 and 1.3430 support. The level to beat for bulls is 1.3570. A break above it can lead to 1.3660 swing high.
Additional key levels
