- Overbought RSI can again question optimists around 61.8% Fibonacci retracement.
- 200-day SMA offers strong downside support.
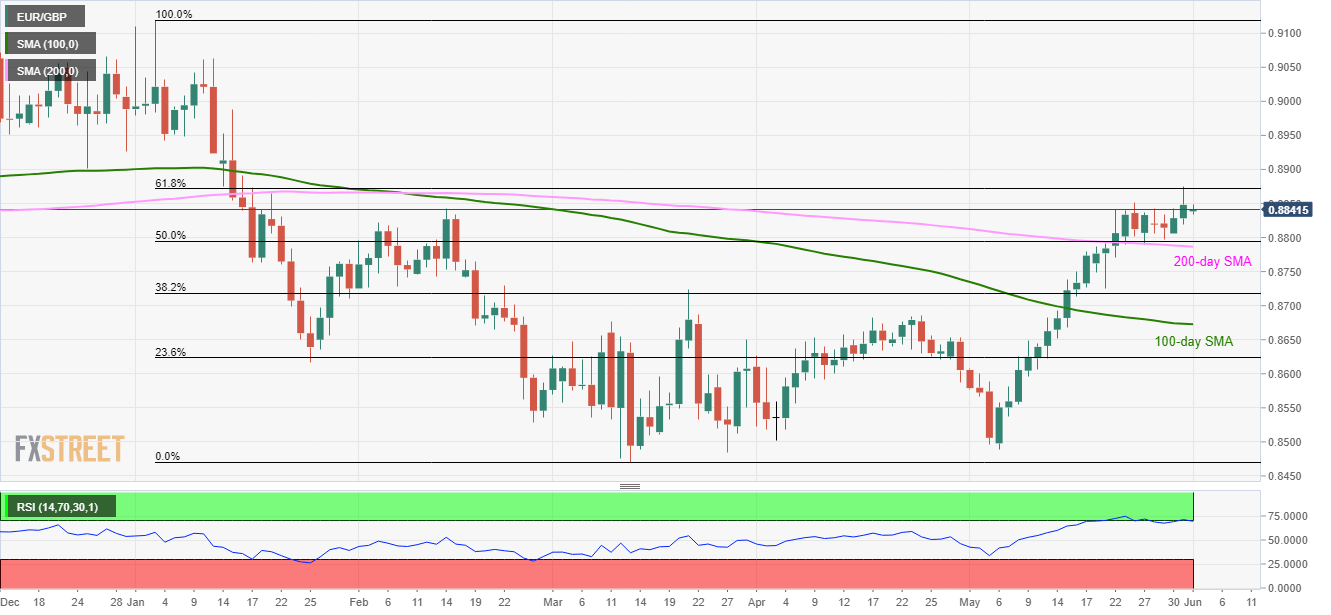
Despite failing to clear 61.8% Fibonacci retracement during late-Friday, EUR/GBP again aims to conquer the upside barrier as it trades near 0.8840 while heading into the European open on Monday.
Should prices clear 0.8875 resistance comprising 61.8% Fibonacci retracement of January – March downturn, December 25 bottom around 0.8900 becomes the key for buyers.
Additionally, pair’s ability to cross 0.8900 enables it to challenge 0.8945/50 and mid-January highs surrounding 0.9000 mark.
Meanwhile, 50% Fibonacci retracement level near 0.8800 and 0.8785 figure encompassing 200-day simple moving average (SMA) can entertain sellers during the pullback.
However, 0.8720 and 100-day SMA level of 0.8672 might trigger the pair’s U-turn past-0.8785.
It’s worth noting down that 14-day relative strength index (RSI) is near the overbought area indicating brighter chances of a price pullback.
EUR/GBP daily chart
Trend: Pullback expected
